Visualization of Superhero Characters using Python
Last Updated : 28 Apr, 2025
There are a number of different libraries in Python that can be used to create visualizations of superhero characters. Some popular libraries include Matplotlib, Seaborn, and Plotly.
In this article, we use Matplotlib to generate visualizations and get insights from the Superheroes Dataset.
Matplotlib is a plotting library for Python that provides an object-oriented API for embedding plots into applications using general-purpose GUI toolkits like Tkinter, wxPython, Qt, or GTK. It has a wide range of capabilities and can create a variety of different types of plots, including line plots, scatter plots, bar plots, pie plots, and more.
CSV (Comma Separated Values) is a file format that stores data in a tabular form, i.e., in the form of rows and columns where each column is separated by a comma.
For generating better conclusions and plotting visualizations from the dataset, first, the data should be reliable and clean. Pre-processing of data is the major step to be performed for any dataset to get insights from it. It means we need to check whether all the values are present in the dataset or not. Find any missing values and fill in or remove them completely if needed.
So, Let's import the required libraries and clean our dataset. Later, we can perform some visualizations accordingly.
Step 1: Importing required libraries.
Python3 # importing libraries.. import pandas as pd import numpy as np import matplotlib.pyplot as plt
Step 2: Cleaning the dataset and find any missing values.
Python3 # Reading Superheroes CSV File using pandas.. df = pd.read_csv("C:/Users/admin/Downloads/superheroes_stats.csv") # displaying first 10 rows df.head(10) Output:
We can observe columns 7 and 8 have missing values (NaN). So, they need to be removed.
 Superheroes Dataset
 Let's list out how many missing values the dataset contains through the below code.
Python3 # Missing values in dataset.. columns = list(df) for column in columns: print("No. of missing values in", column, "attribute:", df[column].isnull().sum()) # Dropping missing values df = df.dropna(axis=0) Output:
From the above python code, we found the dataset contains null values for the entire columns of some specific rows. So, such rows are dropped entirely with dropna( ) method for our effective use of dataset.
 Missing Values in each column of the dataset
 Step 3: Getting insights from the Superheroes dataset.
Data Insight 1:
Let's find the nature (good, bad and neutral) of superheroes with the help of the Alignment column from the dataset.
Python3 # Getting count of good, bad and neutral characters cnt = df['Alignment'].value_counts() print(cnt)
Output:
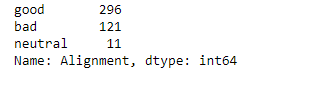 Nature of Superhero characters count
 Plotting pie-plot to know the percentage of superheroes with good, bad and neutral natures.
Python3 # Plotting a pie-plot & getting Nature of super-heroes.. label = ['good', 'bad', 'neutral'] plt.pie(cnt, labels=label, autopct='%.2f%%') plt.show()
Output:
 percentage of good, bad & neutral nature of superheroes
 Data Insight 2:
Let's find the top 10 superheroes who are good-natured.
Python3 # Top ten good superheroes good = df[df['Alignment'] == "good"] Top_ten = good.sort_values(by=['Total'], ascending=False).head(10) x = Top_ten['Name'] y = Top_ten['Total'] # setting width and height of the figure plt.figure(figsize=(10, 5)) y_ticks = np.arange(0, y.max()+50, 50) plt.xticks(rotation=80, fontsize=12) plt.yticks(y_ticks) plt.title("Top 10 good super-heroes", fontsize=22) # plt.grid(visible=None) plt.bar(x, y, color="g") plt.show() Output:
From the output, we can see that the overall top superheroes are Martian Manhunter, Superman, Stardust, Thor, Supergirl, Nova, Goku, Jean Grey, Phoenix and Iron Man.
 Top 10 Superheroes
 Data Insight 3:
Now, let's find all the good superheroes having the Highest Strength and Intelligence.
Python3 # Good Superheroes with highest Strength and Intelligence... Max_strength_Intelligence = good.sort_values( by=['Strength', 'Intelligence'], ascending=False) Max_strength_Intelligence
Output:
 Filtered Dataset with high Strength & Intelligence Superheroes Python3
 # Top Good Superheroes with both highest strength & Intelligence X = Max_strength_Intelligence['Name'][0:5] Intelligence = Max_strength_Intelligence['Intelligence'][0:5] Strength = Max_strength_Intelligence['Strength'][0:5] X_axis = np.arange(len(X)) plt.figure(figsize=(10, 5)) # creating bar graph plt.bar(X_axis - 0.2, Intelligence, 0.4, label='Intelligence') plt.bar(X_axis + 0.2, Strength, 0.4, label='Strength') plt.xticks(X_axis, X) plt.xlabel("Super-heroes", fontsize=18) plt.ylabel("Strength and Intelligence", fontsize=18) plt.title("Good Superheroes with highest Strength and Intelligence", fontsize=18) plt.legend() plt.show() Output:
From this output, we can conclude that Captain Marvel, Martian Manhunter, Superman, Beyonder and Hulk have high Strength and Intelligence compared to other characters.
 Comparing both the highest Strengths & Intelligence of Good Superheroes
 Data Insight 4:
Let's find the Top 5 Highest Power Superheroes along with the highest Speeds.
Python3 # Good Superheroes with both highest Powers and Speeds... Max_Power_Speed = good.sort_values(by=['Power', 'Speed'], ascending=False) Max_Power_Speed
Output:
 Python3
 # Top Superheroes with Good character who have highest speed and power.. X = Max_Power_Speed['Name'][0:5] Speed = Max_Power_Speed['Speed'][0:5] Power = Max_Power_Speed['Power'][0:5] X_axis = np.arange(len(X)) plt.figure(figsize=(9, 5)) plt.bar(X_axis - 0.2, Speed, 0.4, label='Speed', color='y') plt.bar(X_axis + 0.2, Power, 0.4, label='Power', color='g') plt.xticks(X_axis, X) plt.xlabel("Super-heroes", fontsize=18) plt.ylabel("Speed and Power", fontsize=18) plt.title("Good Superheroes with highest Speed and Power", fontsize=18) plt.legend(bbox_to_anchor=(1.05, 1.0), loc='upper left') plt.show() Output:
 Bar plot shows Superheroes with the highest Speeds & Powers
 Data Insight 5:
Plotting Histogram to know the distribution of Speeds of Good Super-heroes from the dataset:
Python3 # plotting histogram for knowing the speeds of good superheroes.. plt.figure(figsize=(12, 6)) X = good['Speed'] plt.xticks(np.arange(0, len(X), 5)) # plotting a histogram plt.hist(X) plt.title("Distribution of Speed", fontsize=20) plt.xlabel("Speed", fontsize=18) plt.ylabel("Number of Super-heroes", fontsize=18) plt.show() Output:
From the Distribution of the Speed histogram, we observe that there are 20 good superheroes with highest speed between 90-100 and there are 80 good superheroes with 25-35 speed range.
 Histogram showing the Distribution of Speed
 Data Insight 6:
Plotting Line chart to know the superheroes with Total Superpower
The 'Total' column value in the dataset includes the sum of the superhero's Intelligence, Strength, Speed, Durability, Power and Combat values.
Python3 # Plotting superheroes with total superpower plt.figure(figsize=(12, 6)) Top_ten_total = df.sort_values(by='Total', ascending=False).head(10) X = Top_ten_total['Name'] Y = Top_ten_total['Total'] plt.xticks(rotation=80) # plotting line chart plt.plot(X, Y, 'o-', color='g') plt.ylabel("Total Superpower", fontsize=18) plt.xlabel("Superheroes", fontsize=18) plt.title("Line chart with Total Strength of Superheroes", fontsize=20) plt.show() Output:
 Line chart of top-ten superheroes with Total power
 In this way, we can generate many such visualizations, customize them and gather insights from the data.
Data Insight - 7 :
Plotting bar charts of only Good super heroes with highest strength and durability
We all know that to defeat enemy and win fights easily having durability is as much important as having sheer strength. So in this plot we will check which good natured super heroes have the highest strength and durability.
Python3 good = df[df['Alignment'] == "good"] Max_strength_durability = good.sort_values( by=['Strength', 'Durability'], ascending=False) Max_strength_durability
 Python3
 # Top Good Superheroes with both highest strength & Durability X = Max_strength_durability['Name'][0:5] Durability = Max_strength_durability['Durability'][0:5] Strength = Max_strength_durability['Strength'][0:5] X_axis = np.arange(len(X)) plt.figure(figsize=(10, 5)) # creating bar graph plt.bar(X_axis - 0.2, Durability, 0.4, label='Durability') plt.bar(X_axis + 0.2, Strength, 0.4, label='Strength') plt.xticks(X_axis, X) plt.xlabel("Super-heroes", fontsize=18) plt.ylabel("Strength and Durability", fontsize=18) plt.title("Good Superheroes with highest Durability and Strength", fontsize=18) plt.legend() plt.show() Output -

Similar Reads
Python - Data visualization using Bokeh Bokeh is a data visualization library in Python that provides high-performance interactive charts and plots. Bokeh output can be obtained in various mediums like notebook, html and server. It is possible to embed bokeh plots in Django and flask apps. Bokeh provides two visualization interfaces to us
4 min read
Dynamic Visualization using Python Data visualization in Python refers to the pictorial representation of raw data for better visualization, understanding, and inference. Python provides various libraries containing different features for visualizing data and can support different types of graphs, i.e. Matplotlib, Seaborn, Bokeh, Plo
11 min read
Data Visualization using Matplotlib in Python Matplotlib is a widely-used Python library used for creating static, animated and interactive data visualizations. It is built on the top of NumPy and it can easily handles large datasets for creating various types of plots such as line charts, bar charts, scatter plots, etc. These visualizations he
10 min read
Python - Data visualization tutorial Data visualization is a crucial aspect of data analysis, helping to transform analyzed data into meaningful insights through graphical representations. This comprehensive tutorial will guide you through the fundamentals of data visualization using Python. We'll explore various libraries, including M
7 min read
Interactive visualization of data using Bokeh Bokeh is a Python library for creating interactive data visualizations in a web browser. It offers human-readable and fast presentation of data in an visually pleasing manner. If you’ve worked with visualization in Python before, it’s likely that you have used matplotlib. But Bokeh differs from matp
4 min read