State Machine Diagrams | Unified Modeling Language (UML)
Last Updated : 08 Apr, 2025
A State Machine Diagram is used to represent the condition of the system or part of the system at finite instances of time. It’s a behavioral diagram and it represents the behaviour using finite state transitions. In this article, we will explain what is a state machine diagram, the components, and the use cases of the state machine diagram.

What is a State Machine Diagram?
A State diagram is a UML diagram which is used to represent the condition of the system or part of the system at finite instances of time. It’s a behavioral diagram and it represents the behavior using finite state transitions.
- State Machine diagrams are also known as State Diagrams and State-Chart Diagrams. These both terms can be used interchangeably.
- A state machine diagram is used to model the dynamic behaviour of a class in response to time and changing external stimuli( events that cause the system to change its state from one to another).
- We can say that every class has a state but we don't model every class using State Machine diagrams.
Let's understand the State Machine Diagram with the help user verification example:
Example:
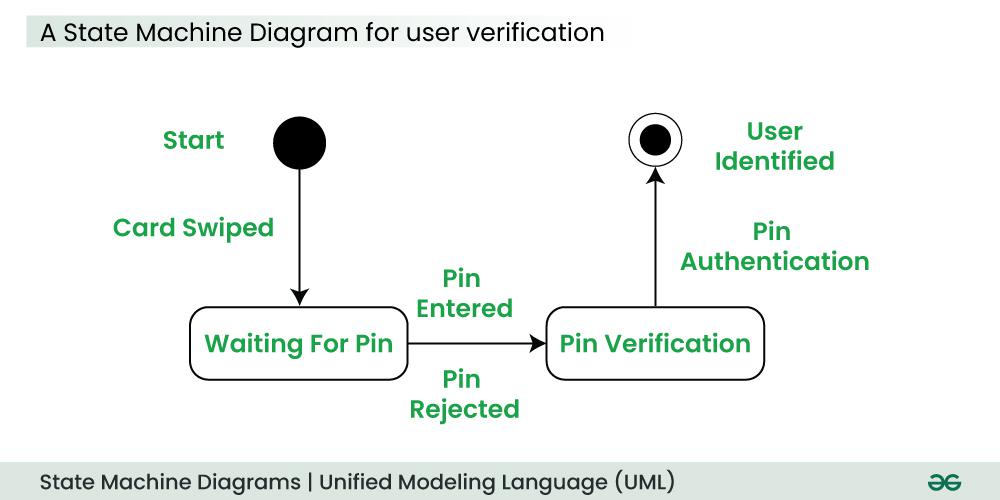
The State Machine Diagram above shows the different states in which the verification sub-system or class exists for a particular system.
Basic Components and Notations of a State Machine Diagram
Below are the basic components and their notations of a State Machine Diagram:
1. Initial state
We use a black filled circle represent the initial state of a System or a Class.
.jpg)
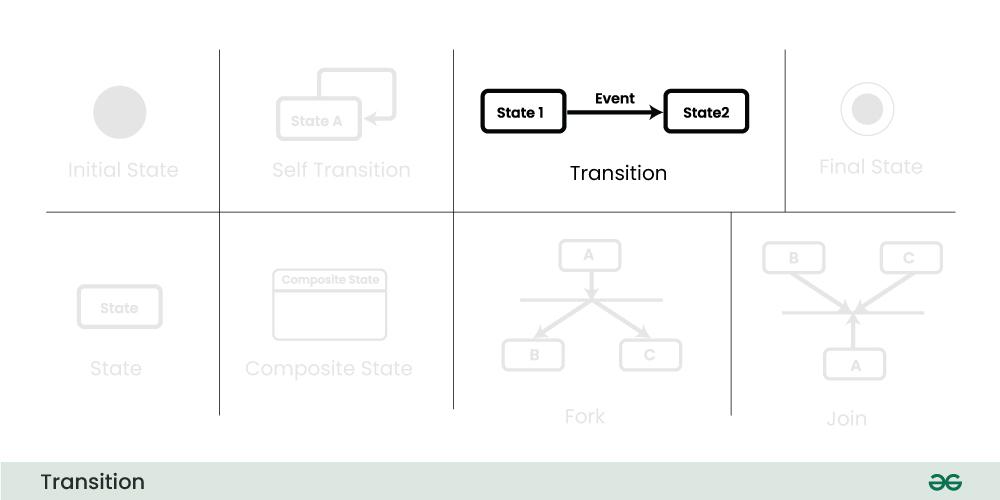
2. Transition
We use a solid arrow to represent the transition or change of control from one state to another. The arrow is labelled with the event which causes the change in state.
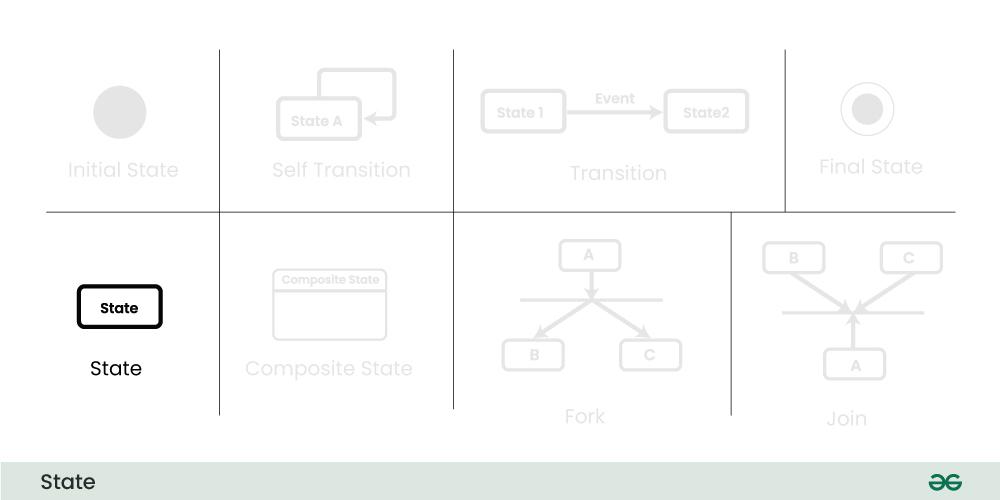
3. State
We use a rounded rectangle to represent a state. A state represents the conditions or circumstances of an object of a class at an instant of time.
4. Fork
We use a rounded solid rectangular bar to represent a Fork notation with incoming arrow from the parent state and outgoing arrows towards the newly created states. We use the fork notation to represent a state splitting into two or more concurrent states.
.jpg)
5. Join
We use a rounded solid rectangular bar to represent a Join notation with incoming arrows from the joining states and outgoing arrow towards the common goal state. We use the join notation when two or more states concurrently converge into one on the occurrence of an event or events.
.jpg)
6. Self transition
We use a solid arrow pointing back to the state itself to represent a self transition. There might be scenarios when the state of the object does not change upon the occurrence of an event. We use self transitions to represent such cases.

7. Composite state
We use a rounded rectangle to represent a composite state also. We represent a state with internal activities using a composite state.

8. Final State
We use a filled circle within a circle notation to represent the final state in a state machine diagram.
.jpg)
How to draw a State Machine diagram in UML?
Below are the steps on how to draw the State Machine Diagram in UML:
.jpg)
Step 1: Identify the System:
- Understand what your diagram is representing.
- Whether it's a machine, a process, or any object, know what different situations or conditions it might go through.
Step 2: Identify Initial and Final States:
- Figure out where your system starts (initial state) and where it ends (final state).
- These are like the beginning and the end points of your system's journey.
Step 3: Identify Possible States:
- Think about all the different situations your system can be in.
- These are like the various phases or conditions it experiences.
- Use boundary values to guide you in defining these states.
Step 4: Label Triggering Events:
- Understand what causes your system to move from one state to another.
- These causes or conditions are the events.
- Label each transition with what makes it happen.
Step 5: Draw the Diagram with appropriate notations:
- Now, take all this information and draw it out.
- Use rectangles for states, arrows for transitions, and circles or rounded rectangles for initial and final states.
- Be sure to connect everything in a way that makes sense.
Example: Online Order System
Let's understand State Machine diagram with the help of an example, ie for an Online Order :

The UML diagrams we draw depend on the system we aim to represent. Here is just an example of how an online ordering system might look like :
- On the event of an order being received, we transition from our initial state to Unprocessed order state.
- The unprocessed order is then checked.
- If the order is rejected, we transition to the Rejected Order state.
- If the order is accepted and we have the items available we transition to the fulfilled order state.
- However if the items are not available we transition to the Pending Order state.
- After the order is fulfilled, we transition to the final state. In this example, we merge the two states i.e. Fulfilled order and Rejected order into one final state.
Note: Here we could have also treated fulfilled order and rejected order as final states separately.
Applications of State Machine Diagram
Below are the main use cases of state machine diagram:
- State Machine Diagrams are very useful for modeling and visualizing the dynamic behavior of a system.
- They are also used in UI design where they help to illustrate how the interface changes in response to user actions, helping designers to create a better use experience.
- In game design, state machine diagrams can help model the behavior of characters or objects, detailing how they change states based on player interactions or game events
- In embedded systems, where hardware interacts with software to perform tasks, State Machine Diagrams are valuable for representing the control logic and behavior of the system.
What are the Differences between a State Machine Diagram and a Flowchart?
Before understanding the differences between a state machine diagram and a flowchart, firstly understand what is a flowchart:
An algorithm is like a set of clear instructions to solve a problem, and a flowchart is a picture that shows those instructions.
- When we're writing computer programs, a flowchart helps us map out the steps of the algorithm to solve the problem.
- Non programmers use Flow charts to model workflows.
- We can call a flowchart a primitive version of an activity diagram.
- Business processes where decision making is involved is expressed using a flow chart.
Example:
A manufacturer uses a flow chart to explain and illustrate how a particular product is manufactured.
State Machine Diagram vs. Flow Chart?
Below are the main differences between a state machine diagram and a flowchart:
State Machine Diagram | Flow Chart |
|---|
An State Machine Diagram is associated with the UML(Unified Modelling Language) | A Flow Chart is associated with the programming. |
The basic purpose of a state machine diagram is to portray various changes in state of the class and not the processes or commands causing the changes. | A flowchart on the other hand portrays the processes or commands that on execution change the state of class or an object of the class. |
Primarily used for systems, emphasizing their states and transitions. | Often used for processes, procedures, or algorithms involving actions and decisions. |
Conclusion
State Machine Diagrams in UML are like pictures that tell us how things change in a system. They show the different situations a system can be in and how it moves between them. These diagrams help us understand what events make these changes happen. Whether it's for designing software or explaining how something works, State Machine Diagrams are like visual guides that make it easier to see and understand how a system behaves in different situations.
Similar Reads
What are UML Diagrams
Unified Modeling Language (UML) Diagrams Unified Modeling Language (UML) is a general-purpose modeling language. The main aim of UML is to define a standard way to visualize the way a system has been designed. It is quite similar to blueprints used in other fields of engineering. UML is not a programming language, it is rather a visual lan
14 min read
UML Full Form The full form of UML is "Unified Modeling Language". It is a general-purpose modeling language. The main aim of UML is to define a standard way to visualize how a system has been designed. It is quite similar to blueprints used in other fields of engineering. UML is not a programming language, it is
3 min read
Structural Diagrams
Class Diagram | Unified Modeling Language (UML) A UML class diagram is a visual tool that represents the structure of a system by showing its classes, attributes, methods, and the relationships between them. It helps everyone involved in a project—like developers and designers—understand how the system is organized and how its components interact
12 min read
Object Diagrams | Unified Modeling Language (UML) Object diagrams are a visual representation in UML (Unified Modeling Language) that illustrates the instances of classes and their relationships within a system at a specific point in time. They display objects, their attributes, and the links between them, providing a snapshot of the system's struc
8 min read
Deployment Diagram in Unified Modeling Language(UML) A Deployment Diagram is a type of Structural UML Diagram that shows the physical deployment of software components on hardware nodes. It illustrates the mapping of software components onto the physical resources of a system, such as servers, processors, storage devices, and network infrastructure.Ta
8 min read
Package Diagram – Unified Modeling Language (UML) A package diagram is a type of structural diagram in UML (Unified Modeling Language) that organizes and groups related classes and components into packages. It visually represents the dependencies and relationships between these packages, helping to illustrate how different parts of a system interac
7 min read
Behavioral Diagrams
Behavioral Diagrams | Unified Modeling Language(UML) Complex applications need collaboration and planning from multiple teams and hence require a clear and concise way to communicate amongst them. So UML becomes essential to communicate with non-programmers about essential requirements, functionalities, and processes of the system. UML is linked with
7 min read