Trigonometric functions study the relationship between the lengths, heights, and angles of right triangles. As the name implies, trigonometry is referred to as the study of triangles.
There are six trigonometric ratios or functions, which are one of the simplest periodic functions. Sine, cosine, and tangent functions are the most widely used trigonometric functions, whereas their reciprocal functions, cosecant, secant, and cotangent functions, are used less.
Here, we will discuss graphs of various Trigonometric functions.
Sine Function
A sine function is denoted as "sin" and is defined as the ratio of the length of the opposite side/perpendicular to the length of the hypotenuse to the given angle.
sin θ = Opposite side/Hypotenuse
Now, let's plot the sine function's graph using the standard trigonometric values.
θ | -360° | -270° | -180° | -90° | 0° | 30° | 45° | 60° | 90° | 180° | 270° | 360° |
|---|
y = sin θ | 0 | 1 | 0 | −1 | 0 | 1/2=0.5 | 1/√2=0.707 | √3/2=0.8660 | 1 | 0 | −1 | 0 |
|---|
In the graph of the sine function, the values of angles (degrees) are taken on the X-axis while the values of y = sin θ at each given angle are taken on the Y-axis. A sine function is defined for every real number, which means the domain of the sine function is (-∞, +∞).

From the graph, we can observe that the maximum value of the sine function is 1, while its minimum value is -1. So, the amplitude of the sine function is half of the distance between the maximum value and the minimum value.
As a result, the amplitude is one [(1 - (-1))/2 = 1]. From the graph, we can also observe that the pattern is repeating over and over after a period of 2π.
We can notice that the graph is passing through the X-axis where the value of θ is multiples of π, so the roots or zeros of the sine function are the multiples of π. At each point, the height of the curve is equal to the sine of the line value.
Domain | (-∞, + ∞) |
|---|
Range | [-1, +1] |
|---|
Minimum value | −1 |
|---|
Maximum value | 1 |
|---|
Amplitude | 1 |
|---|
Period | 2π |
|---|
X−intercept | x=nπ, ∀n |
|---|
Y−intercept | y = 0 |
|---|
Line of symmetry | Origin |
|---|
Type of function | Odd function |
|---|
Cosine Function
A cosine function is denoted as "cos" and is defined as the ratio of the length of the adjacent side/base to the length of the hypotenuse to the given angle.
cos θ = Adjacent side/Hypotenuse
Now, let's plot the graph of the cosine function using the standard values of trigonometric functions.
θ | -360° | -270° | -180° | -90° | 0° | 30° | 45° | 60° | 90° | 180° | 270° | 360° |
|---|
y = cos θ | 1 | 0 | 1 | 0 | 1 | √3/2=0.8660 | 1/√2=0.707 | 1/2=0.5 | 0 | −1 | 0 | 1 |
|---|
In the graph of the cosine function, the values of angles (degrees) are taken on the X-axis while the values of y = cos θ at each given angle are taken on the Y-axis. A cosine function is defined for every real number, which means the domain of the cosine function is (-∞, +∞).

From the graph, we can observe that the maximum value of the cosine function is 1, while its minimum value is -1. The amplitude of the cosine function is one and the period is 2π.
We can notice that the graph is passing through the X-axis where the value of θ is an odd multiple of π/2, so the roots or zeros of the cosine function are the odd multiples of π/2. By comparing the graphs of the sine and cosine functions, we can observe that the graph of the cosine function is obtained after shifting the graph of y = sin θ to π/2 units to the left.
Domain | (-∞, + ∞) |
|---|
Range | [-1, +1] |
|---|
Minimum value | −1 |
|---|
Maximum value | 1 |
|---|
Amplitude | 1 |
|---|
Period | 2π |
|---|
X−intercept | x = (2n + 1)π/2, ∀n |
|---|
Y−intercept | y = 1 |
|---|
Line of symmetry | Y-axis |
|---|
Type of function | Even function |
|---|
Tangent Function
A tangent function is denoted as "tan" and is defined as the ratio of the length of the opposite side/perpendicular to the length of the adjacent side/base to the given angle.
tan θ = Opposite side/Adjacent side = sin θ/cos θ
Now, let's plot the graph of the tangent function using the standard values of trigonometric functions.
θ | -360° | -270° | -180° | -90° | 0° | 30° | 45° | 60° | 90° | 180° | 270° | 360° |
|---|
y = tan θ | 0 | undefined | 0 | undefined | 0 | 1/√3 | 1 | √3 | undefined | 0 | undefined | 0 |
|---|
In the graph of the tangent function, the values of angles (degrees) are taken on the X-axis while the values of y = tan θ at each given angle are taken on the Y-axis. A tangent function is defined for every real number, except at the values where the cosine function is zero. We know that a cosine function is zero at the odd multiples of π/2, so the domain of the tangent function is R - (2n + 1)π/2.

The amplitude of the graph of a tangent function is undefined as the curve does not have a maximum or a minimum value and tends to infinity. As the curve repeats after an interval of π, the period of the tangent function is π.
Domain | R - (2n + 1)π/2 |
|---|
Range | (-∞, +∞) |
|---|
Period | π |
|---|
X−intercept | x=nπ, ∀n |
|---|
Y−intercept | y=0 |
|---|
Line of symmetry | Origin |
|---|
Vertical asymptotes | x = (2n + 1)π/2 |
|---|
Type of function | Odd function |
|---|
Cotangent Function
A cotangent function is denoted as "cot" and is defined as the ratio of the length of the adjacent side/base to the length of the opposite side/perpendicular to the given angle.
cot θ = Adjacent side/Opposite side = cos θ/sin θ
Now, let's plot the graph of the cotangent function using the standard values of trigonometric functions.
θ | -360° | -270° | -180° | -90° | 0° | 30° | 45° | 60° | 90° | 180° | 270° | 360° |
|---|
y = cot θ | undefined | 0 | undefined | 0 | undefined | 1/√3 | 1 | √3 | 0 | undefined | 0 | undefined |
|---|
In the graph of the cotangent function, the values of angles (degrees) are taken on the X-axis while the values of y = cot θ at each given angle are taken on the Y-axis. A cotangent function is defined for every real number, except at the values where the sine function is zero. We know that a sine function is zero at the multiples of π, so the domain of the cotangent function is R - nπ.
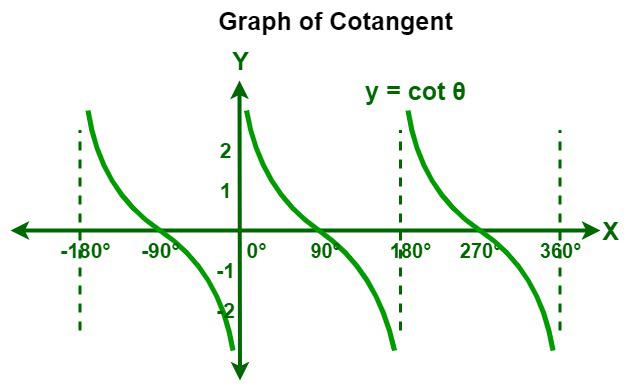
The amplitude of the graph of a cotangent function is undefined as the curve does not have a maximum or a minimum value and tends to infinity. As the curve repeats after an interval of π, the period of the cotangent function is π.
Domain | R - nπ |
|---|
Range | (-∞, +∞) |
|---|
Period | π |
|---|
X−intercept | x = (2n + 1)π/2, ∀n |
|---|
Y−intercept | not applicable |
|---|
Line of symmetry | Origin |
|---|
Vertical asymptotes | x = nπ |
|---|
Type of function | Odd function |
|---|
Cosecant Function
A cosecant function is denoted as "csc or cosec" and is defined as the ratio of the length of the hypotenuse to the length of the opposite side/perpendicular to the given angle.
cosec θ = Hypotenuse/Opposite side = 1/sin θ
Now, let's plot the graph of the cosecant function using the standard values of trigonometric functions.
θ | -360° | -270° | -180° | -90° | 0° | 30° | 45° | 60° | 90° | 180° | 270° | 360° |
|---|
y = csc θ | undefined | 1 | undefined | −1 | undefined | 2 | √2 | 2/√3 | 1 | undefined | −1 | undefined |
|---|
In the graph of the cosecant function, the values of angles (degrees) are taken on the X-axis while the values of y = csc θ at each given angle are taken on the Y-axis. A cosecant function is defined for every real number, except at the values where the sine function is zero. We know that a sine function is zero at the multiples of π, so the domain of the cosecant function is R - nπ.

The amplitude of the graph of a cosecant function is undefined as the curve does not have a maximum or a minimum value and tends to infinity. As the curve repeats after an interval of 2π, the period of the cosecant function is 2π.
Domain | R - nπ |
|---|
Range | (-∞, -1] U [+1, +∞) |
|---|
Period | 2π |
|---|
X−intercept | not applicable |
|---|
Y−intercept | not applicable |
|---|
Line of symmetry | Origin |
|---|
Vertical asymptotes | x = nπ |
|---|
Type of function | Odd function |
|---|
Secant Function
A secant function is denoted as "sec" and is defined as the ratio of the length of the hypotenuse to the length of the adjacent side/base to the given angle.
sec θ = Hypotenuse/Adjacent side = 1/cos θ
Now, let's plot the graph of the secant function using the standard values of trigonometric functions.
θ | -360° | -270° | -180° | -90° | 0° | 30° | 45° | 60° | 90° | 180° | 270° | 360° |
|---|
y = sec θ | 1 | undefined | −1 | undefined | 1 | 2/√3 | √2 | 2 | undefined | −1 | undefined | 1 |
|---|
In the graph of the secant function, the values of angles (degrees) are taken on the X-axis while the values of y = sec θ at each given angle are taken on the Y-axis. A secant function is defined for every real number, except at the values where the cosine function is zero. We know that a cosine function is zero at the odd multiples of π/2, so the domain of the secant function is R - (2n + 1)π/2.

The amplitude of the graph of a secant function is undefined as the curve does not have a maximum or a minimum value and tends to infinity. As the curve repeats after an interval of 2π, the period of the secant function is 2π.
Domain | R - (2n + 1)π/2 |
|---|
Range | (-∞, -1] U [+1, +∞) |
|---|
Period | 2π |
|---|
X−intercept | not applicable |
|---|
Y−intercept | y = 1 |
|---|
Line of symmetry | Y-axis |
|---|
Vertical asymptotes | x = (2n + 1)π/2 |
|---|
Type of function | Even function |
|---|
Important Features of Graphs of Trigonometric Functions
For every trigonometric graph, there are important features: amplitude, vertical shift, period, phase, and phase shift.
- Amplitude: Amplitude is half of the distance between the maximum value and the minimum value, or the height of the curve from the center line.
- Vertical Shift: The displacement of the graph perpendicular to the x-axis is known as vertical shift.
- Period: The period is the distance between the repetitions of any function.
- Phase: The position of the waveform at a fraction of a period is referred to as its phase, and it is expressed in angles or radians.
- Phase Shift: The displacement of the graph perpendicular to the y-axis is known as phase shift.
Have a look at the features mentioned above on the graph, as shown below.

The general form of a sine function is given as follows:
y = a sin (bx + c) + d
Where,
- |a| = Amplitude (the value of "a" alters, the graph will stretch or compress accordingly),
- 2π/|b| = Period,
- c/b = Phase shift, and
- d = Vertical shift.
How to Graph a Trigonometric Function?
To graph a trigonometric function, follow the steps mentioned below:
- Step 1: To draw the graph of a trigonometric function, convert it into its general form, y = a sin (bx + c) + d.
- Step 2: Now, identify the different parameters such as amplitude, phase shift, vertical shift, and period.
- Step 3: The value of the period is 2π/|b| for sine and cosine functions, whereas for tangent and cotangent functions it is π/|b|. Phase shift = -c/b.
- Step 4: Finally, plot the graph using the parameters calculated above.
Next Article: Application of Trigonometry in Real Life.
Read: Trigonometry Complete Tutorial
Solved Examples on Trigonometry Graphs
Example 1: Draw the graph of y = 3 cos 4x + 5.
Solution:
Given: y = 3 cos 4x + 5
Now, compare the given equation with the general form y = a cos (bx + c) + d,
- a = 3, which means the amplitude is 3. (So, the distance between the maximum and minimum value is 6)
- b = 4. Period = 2π/|b| = 2π/|4| = π/2
- c = 0, so there is no phase shift.
- d = 5, which means the graph moved upwards by 5 units.
The graph of y = 3 cos 4x + 5 is given below:

Example 2: Draw the graph of y = cosec x + 3.
Solution:
Given: y = cosec x + 3
- We know that the amplitude of the graph of a cosecant function is undefined as the curve tends to infinity.
- Period = 2π/|b| = 2π/|1| = 2π
- Here, there is no phase shift.
- The graph moved upwards by 3 units.
The graph of y = cosec x + 3 is given below:

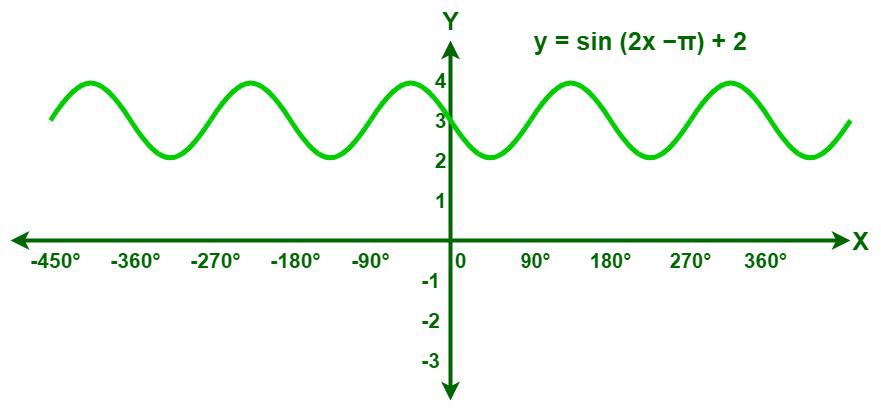
Example 3: Draw the graph of y = sin (2x −π) + 2.
Solution:
Given: y = sin (2x − π) + 2
Now, compare the given equation with the general form y = a sin (bx + c) + d,
- a = 1, which means the amplitude is 1. (So, the distance between the maximum and minimum value is 2)
- b = 2. Period = 2π/|2| = 2π/|2| = π
- c = −π. Phase shift = −c/b = − (−π)/2 = π/2
- d = 2, which means the graph moved upwards by 2 units.
The graph of y = sin (2x −π) + 2 is given below:
Example 4: Draw the graph of y = tan x + 1.
Solution:
Given: y = tan x + 1
- We know that the amplitude of the graph of a tangent function is undefined as the curve does not have a maximum or a minimum value and tends to infinity.
- Period = π/|1| = π/|1| = π
- Here, there is no phase shift.
- The graph moved upwards by 1 unit.
The graph of y = tan x + 1 is given below:

Example 5: Draw the graph of y = 2 sin x + 3.
Solution:
Given: y = 2 sin x + 3
Now, compare the given equation with the general form y = a sin (bx + c) + d,
a = 2, which means the amplitude is 2. (So, the distance between the maximum and minimum value is 2)
b = 1. Period = 2π/|1| = 2π/|1| = 2π
c = 0, so there is no phase shift.
d = 3, which means the graph moved upwards by 3 units.
The graph of y = 2 sin x + 3 is given below:

Read More,
Similar Reads
Trigonometric Ratios There are three sides of a triangle Hypotenuse, Adjacent, and Opposite. The ratios between these sides based on the angle between them is called Trigonometric Ratio. The six trigonometric ratios are: sine (sin), cosine (cos), tangent (tan), cotangent (cot), cosecant (cosec), and secant (sec).As give
4 min read
Trigonometric Cheat Sheet Trigonometry is the branch of mathematics that studies the relationships between the angles and sides of triangles. However, trigonometry can also be challenging to learn and remember, especially when dealing with complex problems and formulas. That is why having a trigonometric cheat sheet can be v
8 min read
Trigonometry in Math We use trigonometry in many everyday situations, often without even noticing. Construction and Architecture: Trigonometry helps calculate angles and heights when designing buildings, bridges, and roads. For example, architects use it to determine roof slopes or the angle of staircases.Navigation: Pi
3 min read
Trigonometric Symbols Trigonometric Symbols are the symbols that are used in trigonometry and help to solve various problems. The trigonometric symbols are used to represent various trigonometric ratios. Trigonometry is a branch of mathematics that explores the relationships between the ratios of the sides of a right-ang
3 min read
Trigonometric Functions Trigonometric Functions, often simply called trig functions, are mathematical functions that relate the angles of a right triangle to the ratios of the lengths of its sides.Trigonometric functions are the basic functions used in trigonometry and they are used for solving various types of problems in
6 min read