How to Draw Entity Relationship Diagrams (ERDs)
Last Updated : 11 Mar, 2025
Entity Relationship Diagrams serve as valuable tools for designing complex systems and their relationships. This article will go through the step-by-step process of designing an ER diagram and defining how entities, attributes, and relationships are defined. Entity relationship diagrams are important in database design and require a clear structure for all data.
What is an Entity Relationship Diagram?
An Entity Relationship Diagram (ERD) is a graphical representation that shows how entities, such as people, objects, or concepts, relate to each other within a system.
ERDs are commonly used in database design to visualize the relationships between entities and their attributes.
They help in understanding the logical structure of databases by showing entities' connections and relationships using symbols like rectangles, diamonds, ovals, and connecting lines.
ERDs are essential for designing or debugging relational databases in software engineering, business information systems, education, and research.
Need to Draw ER Diagram
ER diagram or ER model, is drawn to visually represent the relationships between entities in a database system. Some benefits of drawing ER diagrams for database design are:
- It helps in understanding the data relationships.
- ER diagrams are like a blueprint for designing a database.
- Helps in communicating about databases with database designers, developers, users, etc.
- They help in describing different relationships and operations within an organization.
How to Draw an Entity Relation Diagram (ERD)
A step-by-step process to draw an entity relation diagram (ERD) is:
Step 1: Identifying Entities
Determine the main objects you want to represent in the database. Eg, "students", "courses", or "products".
Step 2: Defining Attributes
Identify the properties(attributes) of properties of each entity. These attributes provide more details about an entity.
Step 3: Specifing Relationships
Create relationships between entities to specify how entities interact with each other. Relationships are verbs like "teaches", "studies", or "sells".
Step 4: Drawing Entities
Draw entities as rectangle and write the name.
Step 5: Adding Attributes
To add attributes of a entitity write attributes inside the rectangle or connect them with lines.
Step 6: Connecting Entities
Draw lines between the related entities to represent their connection.
Step 7: Specifying Cardinality
Indicate the minimum and maximum number of relationship instances associated with an entity using notations like crow's foot.
Step 8: Organizing ER Diagram
Organize all entities and relationships in a clean way for better readibility and understanding.
Draw Entity Relationship Diagram Example
After learning the steps of how to draw an enitity relationship diagram, we will create a demo ER diagram.
Let’s take an example of ER diagram for a bank through which we can learn how to design an ER and understand all the required methods.
Entity Relationship Diagram for BANK
We will follow the steps mentioned above, to draw entity relationship diagram for bank.
Defining Entities
A thing in the real world with an independent existence. It is may be an object with physical existence (ex: house, person) or with a conceptual existence (ex: course, job). The are represented by rectangle.
Entities for Bank are:
Bank, Branch, Employee, customer, loan, account.
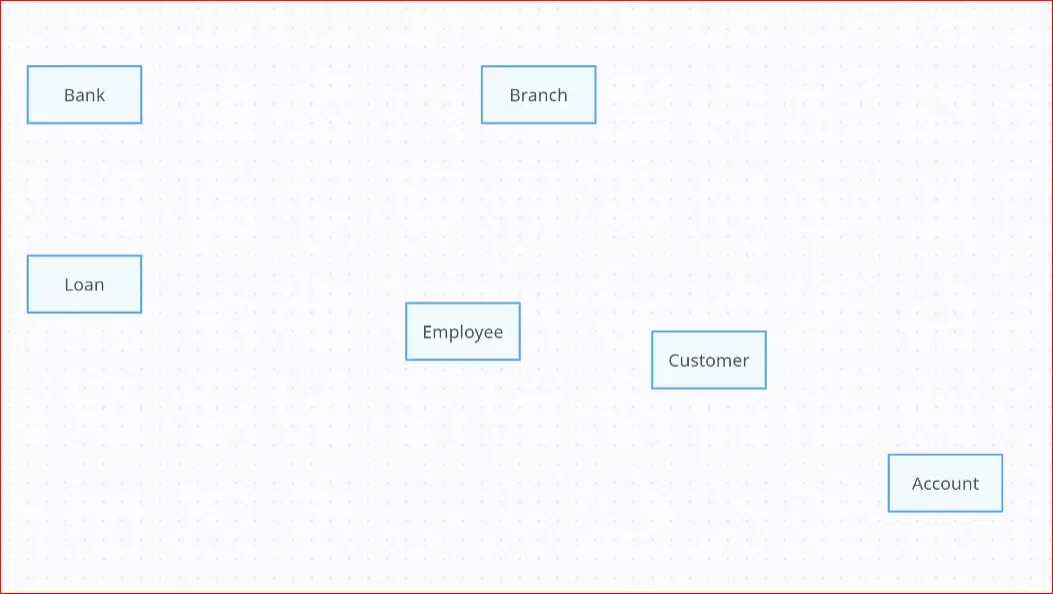 Entities
Adding Attributes
Attributes are the kind of properties that describe the entities. They are represented by ovals.
Attributes for Bank are:
- For Bank Entity the Attributes are Bname, code.
- For Branch Entity the Attributes are Blocation, Bname.
- For Employee Entity the Attributes are Eid, Designation, salary.
- For Customer Entity the Attributes are Cid, Cname, Address, DOB.
- For Loan Entity the Attributes are Loan_no, amount, rate.
- For Account Entity the Attributes are acc_no, type.
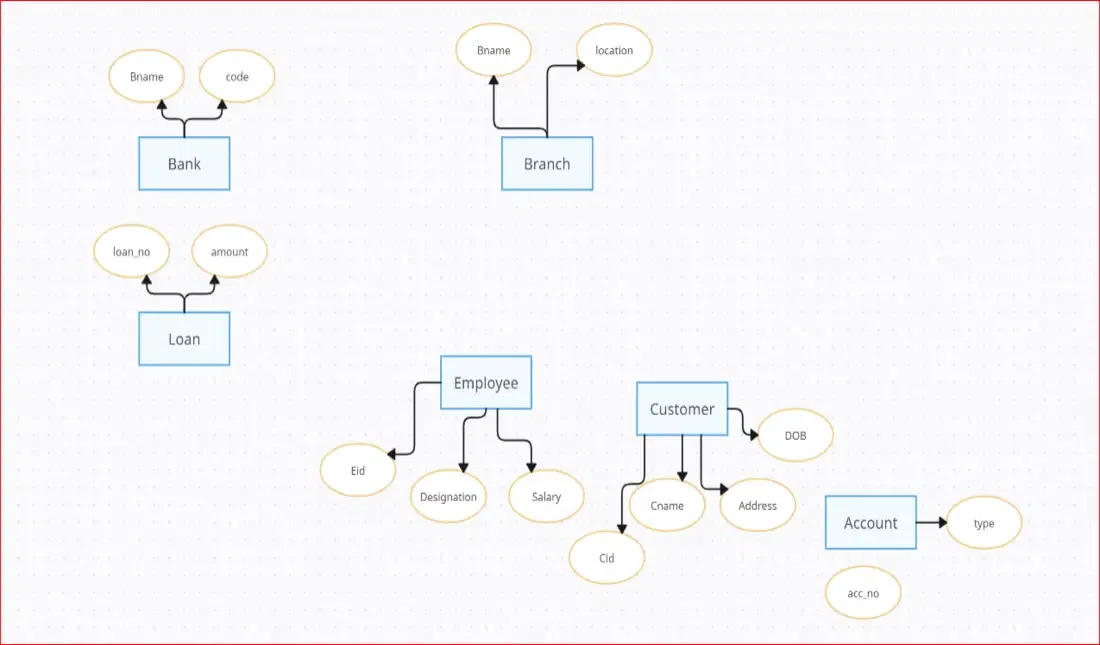 Attributes
Establishing Relationships
Entities have some relationships with each other. Relationships define how entities are associated with each other.
Let's Establishing Relationships between them are:
- The Bank has branches.
- The Branch provides loan.
- The Employee works in branch.
- The Branch contains customers.
- The Customers has account.
- The Branch maintains account.
- The Customer avails loan.
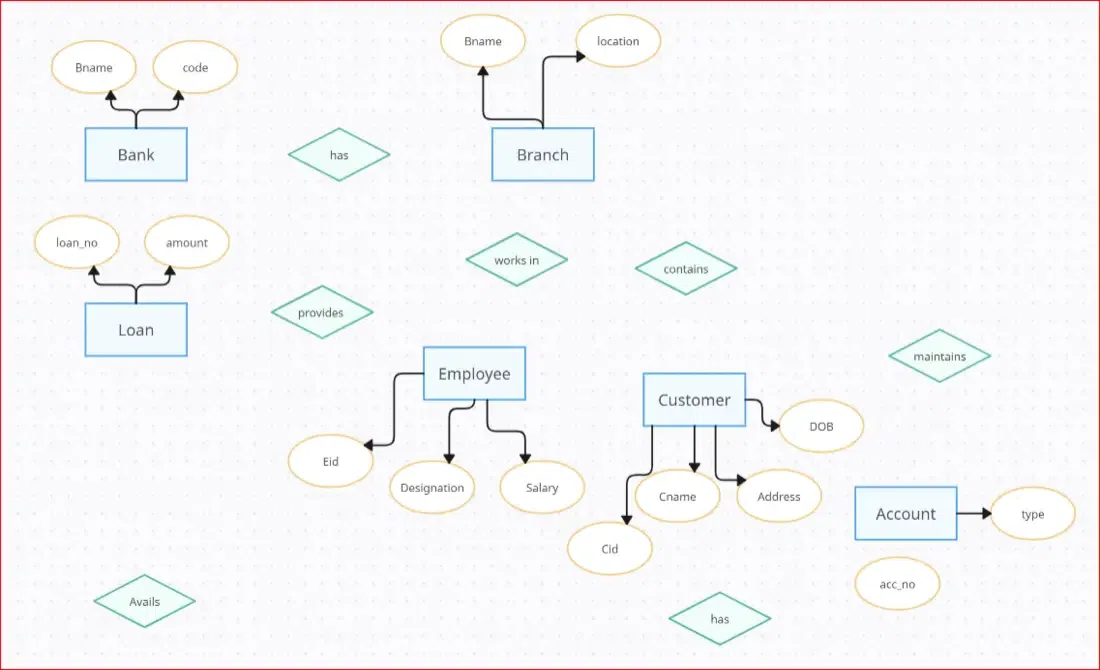 Relationships
Specifying Cardinality
Cardinality defines the numerical constraints on the relationships between entities. It is a notation that tells the ERD reader whether there are one, many or some combination of those factors between each entity.
1. One to One relationship(1:1)
In the entity relationship diagram, the one to one relationship means that single entity in one table is associated with single entity in another table. For example, one driver have only one license.
2. One to Many relationship(1:N)
One to many relationships means that single entity in one table is related to more than one entities in another table. For example, one bank has many branches.
3. Many to One(N:1)
Many-to-one relationship in entity relationship diagram means that multiple entities are related to only single entity in another table. For example, many developers works on single project.
4. Many to Many relationship(M:N)
Many to many relationship means that multiple entities in one table is associated with multiple entities in another table. For example, multiple customers can have multiple accounts.
Specify cardinality for Bank:
- Bank and branch has One to Many relationship (a bank has multiple branches).
- Branch and loan has also One to Many relationship(one branch can provide multiple loans).
- Branch and employee has One to Many relationship(one branch employs multiple employees).
- Branch and account has One to Many relationship(one branch maintains multiple accounts).
- Branch and customer has One to Many relationship(one branch has multiple customers; each customer belongs to one primary branch).
- Customer and account has One to Many relationship(one customer can have multiple accounts, each account belongs to exactly one customer).
- Customer and loan has One to Many relationships(each customer can have multiple loans; each loan belongs to exactly one customer)
 ER Diagram
Identify Primary Keys
Primary keys are the unique identifier for each record in database table. It is denoted by an underline under the attribute name.
- The Primary key of Bank is code.
- The Primary key of Branch is branch_code.
- The Primary key of Employee is Eid.
- The Primary key of Customer is Cid.
- The Primary key of Loan is loan_no.
- The Primary key of Account is acc_no.
Final ER Diagram
The below diagram is our final entity relationship diagram for bank with all entities, their attributes and the relationship between them with the PRIMARY KEY and Cardinality ratio.
.webp) Final ER Diagram
Final ER DiagramBenefits of an ER Diagram
- ER diagrams provides a clear and visual representation of the database structure. This make it easier for developers and designers to understand the relationships between the entities.
- It is an effective communication tool for database designers and the stakeholders which helps to understand the data model.
- ER diagrams serve as the foundation for designing the database schema. They guide the creation of tables, relationships and constraints in the database management system.
- Creating an ER diagram helps in understanding and analyzing the data requirements of the system.
- Database managers can more quickly and efficiently undertake maintenance activities, including adding new entities or changing existing relationships, when they have a well-designed Entity Relationship diagram that makes the database structure easy to understand.
Conclusion
This article covers a step-by-step guide on drawing an ER diagram, focusing on the significance of accurate representation, clear relationships, and well-defined attributes.
It covers the meaning, need, benefits, and an example of an Entity Relationship Diagram (ERD). The provided example showcases the design process for a bank's database, including identifying relationships, cardinality, and primary keys. The ER diagram serves as a visual representation of the database structure, with room for refinement based on specific requirements or stakeholder feedback.