Save multiple matplotlib figures in single PDF file using Python
Last Updated : 28 Apr, 2025
In this article, we will discuss how to save multiple matplotlib figures in a single PDF file using Python. We can use the PdfPages class's savefig() method to save multiple plots in a single pdf. Matplotlib plots can simply be saved as PDF files with the .pdf extension. This saves Matplotlib-generated figures in a single PDF file named Save multiple plots as PDF.pdf in the current working directory.
Installation
pip install matplotlib
Stepwise Implementation
To come up with a solution, we will follow a few steps.
Step 1: Import necessary files.
Python3 from matplotlib import pyplot as plt from matplotlib.backends.backend_pdf import PdfPages
Step 2: Set up the figure size and adjust the padding between and around the subplots.
Python3 plt.rcParams["figure.figsize"] = [7.00, 3.50] plt.rcParams["figure.autolayout"] = True
Step 3: We will consider 3 plots, so let's name them fig1, fig2, and fig3 using plt.figure().
Python3 fig1 = plt.figure() fig2 = plt.figure() Fig3 = plt.figure()
Step 4: Plot the first line using the plt.plot() method.
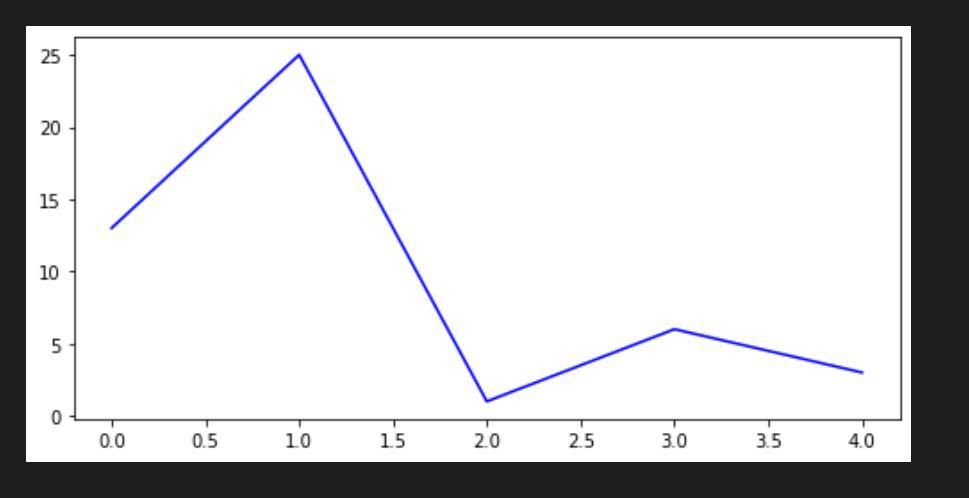
Python3 plt.plot([17, 45, 7, 8, 7], color='orange') plt.plot([13, 25, 1, 6, 3], color='blue') plt.plot([22, 11, 2, 1, 23], color='green')
Step 5: Create a function to save multiple images in a PDF file let's say save_image().
Python3 def save_image(filename): # PdfPages is a wrapper around pdf # file so there is no clash and # create files with no error. p = PdfPages(filename) # get_fignums Return list of existing # figure numbers fig_nums = plt.get_fignums() figs = [plt.figure(n) for n in fig_nums] # iterating over the numbers in list for fig in figs: # and saving the files fig.savefig(p, format='pdf') # close the object p.close()
Complete Code
Python3 import matplotlib from matplotlib import pyplot as plt from matplotlib.backends.backend_pdf import PdfPages # customizing runtime configuration stored # in matplotlib.rcParams plt.rcParams["figure.figsize"] = [7.00, 3.50] plt.rcParams["figure.autolayout"] = True fig1 = plt.figure() plt.plot([17, 45, 7, 8, 7], color='orange') fig2 = plt.figure() plt.plot([13, 25, 1, 6, 3], color='blue') Fig3 = plt.figure() plt.plot([22, 11, 2, 1, 23], color='green') def save_image(filename): # PdfPages is a wrapper around pdf # file so there is no clash and create # files with no error. p = PdfPages(filename) # get_fignums Return list of existing # figure numbers fig_nums = plt.get_fignums() figs = [plt.figure(n) for n in fig_nums] # iterating over the numbers in list for fig in figs: # and saving the files fig.savefig(p, format='pdf') # close the object p.close() # name your Pdf file filename = "multi_plot_image.pdf" # call the function save_image(filename)
Output:
Now after you run the code you can see on your local directory that a pdf containing all three plots will be saved in a pdf named "multi_plot_image.pdf".


Similar Reads
Save Matplotlib Figure as SVG and PDF using Python In this article, we will see how can we save the Matplotlib figure as Scalable Vector Graphics(SVG) using Python or any other file format for further use. The required modules for this tutorial are Matplotlib. Matplotlib is a comprehensive library for creating static, animated, and interactive visua
3 min read
Matplotlib.figure.Figure.savefig() in Python Matplotlib is a library in Python and it is numerical – mathematical extension for NumPy library. The figure module provides the top-level Artist, the Figure, which contains all the plot elements. This module is used to control the default spacing of the subplots and top level container for all plot
2 min read
Multiplots in Python using Matplotlib Matplotlib is a Python library that can be used for plotting graphs and figures. Plotting multiplots or multiple plots are often required either for comparing the two curves or show some gradual changes in the multiple plots, and this can be done using Subplots. Subplots are one of the most importan
3 min read
Matplotlib.figure.Figure.set_size_inches() in Python Matplotlib is a library in Python and it is numerical – mathematical extension for NumPy library. The figure module provides the top-level Artist, the Figure, which contains all the plot elements. This module is used to control the default spacing of the subplots and top level container for all plot
2 min read
Matplotlib.figure.Figure.suptitle() in Python Matplotlib is a library in Python and it is numerical – mathematical extension for NumPy library. The figure module provides the top-level Artist, the Figure, which contains all the plot elements. This module is used to control the default spacing of the subplots and top level container for all plot
2 min read