Skip to content
geeksforgeeks
  • Tutorials
    • Python
    • Java
    • Data Structures & Algorithms
    • ML & Data Science
    • Interview Corner
    • Programming Languages
    • Web Development
    • CS Subjects
    • DevOps And Linux
    • School Learning
    • Practice Coding Problems
  • Courses
    • DSA to Development
    • Get IBM Certification
    • Newly Launched!
      • Master Django Framework
      • Become AWS Certified
    • For Working Professionals
      • Interview 101: DSA & System Design
      • Data Science Training Program
      • JAVA Backend Development (Live)
      • DevOps Engineering (LIVE)
      • Data Structures & Algorithms in Python
    • For Students
      • Placement Preparation Course
      • Data Science (Live)
      • Data Structure & Algorithm-Self Paced (C++/JAVA)
      • Master Competitive Programming (Live)
      • Full Stack Development with React & Node JS (Live)
    • Full Stack Development
    • Data Science Program
    • All Courses
  • Python
  • R Language
  • Python for Data Science
  • NumPy
  • Pandas
  • OpenCV
  • Data Analysis
  • ML Math
  • Machine Learning
  • NLP
  • Deep Learning
  • Deep Learning Interview Questions
  • Machine Learning
  • ML Projects
  • ML Interview Questions
Open In App
Next Article:
Pearson Correlation Testing in R Programming
Next article icon

Pearson Correlation Test Between Two Variables - Python

Last Updated : 17 May, 2025
Comments
Improve
Suggest changes
Like Article
Like
Report

Correlation is a way to measure how strongly two variables are related. In simple terms, it tells us whether two things increase or decrease together. For example:

  • Do people who study more hours get higher scores?
  • Does car weight affect fuel efficiency?

These questions can be answered using a correlation test.

Uses of Correlation in Data Science

  • Understand relationships between two numeric values.
  • Make better decisions in data analysis and machine learning.
  • Select features that are useful for prediction.
  • Avoid using variables that are too similar (which can cause problems).

Types of Correlation Methods

There are two main types of correlation methods:

1. Parametric Correlation

  • Measures the linear dependence between two variables (e.g., x and y).
  • Assumes that the data follows a normal distribution.
  • Example: Pearson Correlation (most commonly used).

2. Non-Parametric Correlation

  • Used when data doesn’t meet parametric assumptions.
  • Based on rankings, not raw values.
  • Examples: Kendall’s Tau, Spearman’s Rho

Note: The Pearson correlation method is the most widely used for linear relationships.

In this article, we will learn about Pearson Correlation:

Pearson Correlation

Pearson correlation is a number that tells us how strongly two values are linearly related.

It gives a result between -1 and +1:

  • +1: Perfect positive relationship (both increase together)
  • -1: Perfect negative relationship (one increases, the other decreases)
  • 0: No linear relationship

Pearson Correlation Formula

x, y: Two numeric vectors of the same length n
mₓ, mᵧ: Mean values of x and y respectively

Important Notes on Pearson Correlation

  • Not suitable for ordinal variables.
  • Requires moderate sample size (20–30) for reliable estimates.
  • Sensitive to outliers, which can distort results.

Computing Pearson Correlation in Python

Python has a built-in method pearsonr() from the scipy.stats module to find the Pearson correlation.

Syntax

from scipy.stats import pearsonr

pearsonr(x, y)

Parameters:

  • x, y are the numeric lists or series.

Return Type: A tuple - (correlation coefficient, p-value)

Example 1: Pearson Correlation with Car Data

In this example, we find the correlation between car weight and miles per gallon (mpg).

Here is a snapshot of the csv file used for this example:
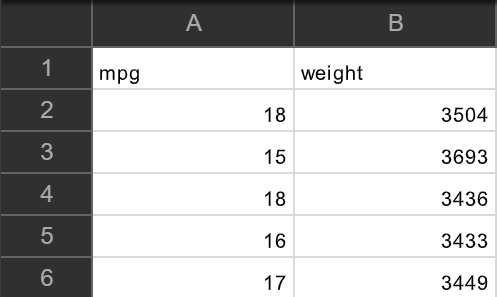
correlation_csv
data.csv

To download the above csv file used in this article, click here.

Code:

Python
import pandas as pd from scipy.stats import pearsonr  df = pd.read_csv("path_to_Auto.csv")  # Convert dataframe into series l1 = df['weight'] l2 = df['mpg']  # Apply the pearsonr() corr, _ = pearsonr(l1, l2) print('Pearsons correlation: %.3f' % corr) 

Output:

Pearson correlation is: -0.878

Example 2: Anscombe’s Quartet – Same Correlation, Different Patterns

Anscombe’s Quartet is a famous example that shows why just using correlation numbers can be misleading. It has four small datasets with almost the same Pearson correlation, but very different shapes when plotted.

In this example, we will:

  • Load the four datasets from a CSV file.
  • Calculate the Pearson correlation for each dataset.
  • Plot all datasets to see how they differ visually.

To downlod those 4 sets of 11 data-points, click here. 

Python
import pandas as pd import matplotlib.pyplot as plt from scipy.stats import pearsonr  # Load your CSV file df = pd.read_csv("path of dataset")  # Store dataset names for looping datasets = {     "I": ("x1", "y1"),     "II": ("x2", "y2"),     "III": ("x3", "y3"),     "IV": ("x4", "y4") }  # Loop through each dataset and calculate Pearson correlation for name, (x_col, y_col) in datasets.items():     x = df[x_col]     y = df[y_col]     corr, _ = pearsonr(x, y)     print(f"Dataset {name}: Pearson correlation = {corr:.3f}")  # Plot each dataset in a grid fig, axs = plt.subplots(2, 2, figsize=(10, 8)) fig.suptitle('Anscombe-like Quartet Plots', fontsize=16)  for i, (name, (x_col, y_col)) in enumerate(datasets.items()):     row = i // 2     col = i % 2     axs[row, col].scatter(df[x_col], df[y_col])     axs[row, col].set_title(f"Dataset {name}")     axs[row, col].set_xlabel(x_col)     axs[row, col].set_ylabel(y_col)  plt.tight_layout(rect=[0, 0.03, 1, 0.95]) plt.show() 

Terminal Output:

Dataset I: Pearson correlation = 0.816
Dataset II: Pearson correlation = 0.816
Dataset III: Pearson correlation = 0.816
Dataset IV: Pearson correlation = 0.817

Here we can see that the correlation is same for all the datasets but let's take a look at their correlation graphs:

Graph Output:

correlation01
Snapshot of the Plots

We can clearly see that the visual representation of them is very different, this shows why it's important to look at your data visually, not just rely on correlation values.

To know more about correlation please refer: Covariance and Correlation.


Next Article
Pearson Correlation Testing in R Programming

A

AmiyaRanjanRout
Improve
Article Tags :
  • Python
  • data-science
Practice Tags :
  • python

Similar Reads

    Python - Pearson Correlation Test Between Two Variables
    Correlation is a way to measure how strongly two variables are related. In simple terms, it tells us whether two things increase or decrease together. For example:Do people who study more hours get higher scores?Does car weight affect fuel efficiency?These questions can be answered using a correlati
    4 min read
    Pearson Correlation Testing in R Programming
    Correlation is a statistical measure that indicates how strongly two variables are related. It involves the relationship between multiple variables as well. For instance, if one is interested to know whether there is a relationship between the heights of fathers and sons, a correlation coefficient c
    5 min read
    How to Perform a Kruskal-Wallis Test in Python
    Kruskal-Wallis test is a non-parametric test and an alternative to One-Way Anova. By non-parametric we mean, the data is not assumed to become from a particular distribution. The main objective of this test is used to determine whether there is a statistical difference between the medians of at leas
    2 min read
    Python | Kendall Rank Correlation Coefficient
    What is correlation test? The strength of the association between two variables is known as the correlation test. For instance, if we are interested to know whether there is a relationship between the heights of fathers and sons, a correlation coefficient can be calculated to answer this question. F
    3 min read
    How to Use Pytest for Efficient Testing in Python
    Writing, organizing, and running tests is made easier with Pytest, a robust and adaptable testing framework for Python. Developers looking to guarantee code quality and dependability love it for its many capabilities and easy-to-use syntax. A critical component of software development is writing tes
    5 min read
    How to Calculate Correlation Between Two Columns in Pandas?
    Correlation is used to summarize the strength and direction of the linear association between two quantitative variables. It is denoted by r and values between -1 and +1. A positive value for r indicates a positive association and a negative value for r indicates a negative association. Let's explor
    3 min read
geeksforgeeks-footer-logo
Corporate & Communications Address:
A-143, 7th Floor, Sovereign Corporate Tower, Sector- 136, Noida, Uttar Pradesh (201305)
Registered Address:
K 061, Tower K, Gulshan Vivante Apartment, Sector 137, Noida, Gautam Buddh Nagar, Uttar Pradesh, 201305
GFG App on Play Store GFG App on App Store
Advertise with us
  • Company
  • About Us
  • Legal
  • Privacy Policy
  • In Media
  • Contact Us
  • Advertise with us
  • GFG Corporate Solution
  • Placement Training Program
  • Languages
  • Python
  • Java
  • C++
  • PHP
  • GoLang
  • SQL
  • R Language
  • Android Tutorial
  • Tutorials Archive
  • DSA
  • Data Structures
  • Algorithms
  • DSA for Beginners
  • Basic DSA Problems
  • DSA Roadmap
  • Top 100 DSA Interview Problems
  • DSA Roadmap by Sandeep Jain
  • All Cheat Sheets
  • Data Science & ML
  • Data Science With Python
  • Data Science For Beginner
  • Machine Learning
  • ML Maths
  • Data Visualisation
  • Pandas
  • NumPy
  • NLP
  • Deep Learning
  • Web Technologies
  • HTML
  • CSS
  • JavaScript
  • TypeScript
  • ReactJS
  • NextJS
  • Bootstrap
  • Web Design
  • Python Tutorial
  • Python Programming Examples
  • Python Projects
  • Python Tkinter
  • Python Web Scraping
  • OpenCV Tutorial
  • Python Interview Question
  • Django
  • Computer Science
  • Operating Systems
  • Computer Network
  • Database Management System
  • Software Engineering
  • Digital Logic Design
  • Engineering Maths
  • Software Development
  • Software Testing
  • DevOps
  • Git
  • Linux
  • AWS
  • Docker
  • Kubernetes
  • Azure
  • GCP
  • DevOps Roadmap
  • System Design
  • High Level Design
  • Low Level Design
  • UML Diagrams
  • Interview Guide
  • Design Patterns
  • OOAD
  • System Design Bootcamp
  • Interview Questions
  • Inteview Preparation
  • Competitive Programming
  • Top DS or Algo for CP
  • Company-Wise Recruitment Process
  • Company-Wise Preparation
  • Aptitude Preparation
  • Puzzles
  • School Subjects
  • Mathematics
  • Physics
  • Chemistry
  • Biology
  • Social Science
  • English Grammar
  • Commerce
  • World GK
  • GeeksforGeeks Videos
  • DSA
  • Python
  • Java
  • C++
  • Web Development
  • Data Science
  • CS Subjects
@GeeksforGeeks, Sanchhaya Education Private Limited, All rights reserved
We use cookies to ensure you have the best browsing experience on our website. By using our site, you acknowledge that you have read and understood our Cookie Policy & Privacy Policy
Lightbox
Improvement
Suggest Changes
Help us improve. Share your suggestions to enhance the article. Contribute your expertise and make a difference in the GeeksforGeeks portal.
geeksforgeeks-suggest-icon
Create Improvement
Enhance the article with your expertise. Contribute to the GeeksforGeeks community and help create better learning resources for all.
geeksforgeeks-improvement-icon
Suggest Changes
min 4 words, max Words Limit:1000

Thank You!

Your suggestions are valuable to us.

What kind of Experience do you want to share?

Interview Experiences
Admission Experiences
Career Journeys
Work Experiences
Campus Experiences
Competitive Exam Experiences