Skip to content
geeksforgeeks
  • Tutorials
    • Python
    • Java
    • Data Structures & Algorithms
    • ML & Data Science
    • Interview Corner
    • Programming Languages
    • Web Development
    • CS Subjects
    • DevOps And Linux
    • School Learning
    • Practice Coding Problems
  • Courses
    • DSA to Development
    • Get IBM Certification
    • Newly Launched!
      • Master Django Framework
      • Become AWS Certified
    • For Working Professionals
      • Interview 101: DSA & System Design
      • Data Science Training Program
      • JAVA Backend Development (Live)
      • DevOps Engineering (LIVE)
      • Data Structures & Algorithms in Python
    • For Students
      • Placement Preparation Course
      • Data Science (Live)
      • Data Structure & Algorithm-Self Paced (C++/JAVA)
      • Master Competitive Programming (Live)
      • Full Stack Development with React & Node JS (Live)
    • Full Stack Development
    • Data Science Program
    • All Courses
  • Data Science
  • Data Science Projects
  • Data Analysis
  • Data Visualization
  • Machine Learning
  • ML Projects
  • Deep Learning
  • NLP
  • Computer Vision
  • Artificial Intelligence
Open In App
Next Article:
Plotting Geospatial Data using GeoPandas
Next article icon

Plotting Geospatial Data using GeoPandas

Last Updated : 16 Jul, 2020
Comments
Improve
Suggest changes
Like Article
Like
Report

GeoPandas is an open source tool to add support for geographic data to Pandas objects. In this, article we are going to use GeoPandas and Matplotlib for plotting geospatial data.

Installation

We are going to install GeoPandas, Matplotlib, NumPy and Pandas.

pip install geopandas  pip install matplotlib  pip install numpy  pip install pandas  

Note: If you don't want to install these modules locally on your computer, use Jupyter Notebook or Google Colab.

Getting Started

Importing modules and dataset

We are going to import Pandas for the dataframe data structure, NumPy for some mathematical functions, GeoPandas for supporting and handling geospatial data and Matplotlib for actually plotting the maps.

import pandas as pd  import geopandas as gpd  import numpy as np  import matplotlib.pyplot as plt

GeoPandas gives us some default datasets along with its installation to play around with. Let's read one of the datasets.

Python3
import pandas as pd import geopandas as gpd import numpy as np import matplotlib.pyplot as plt  world = gpd.read_file(gpd.datasets.get_path('naturalearth_lowres')) world.head() 

Output:

world.head()

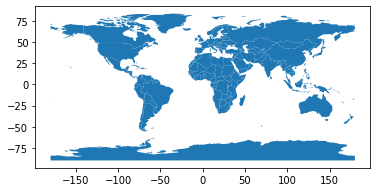
Some of the other datasets to play with are 'naturalearth_cities' and 'nybb'. Feel free to experiment with them later. We can use world and plot the same using Matplotlib.

Python3
world.plot() 

Output:

World Plot

Analyse the datasets

Now, if we see world, we have a lot of fields. One of them is GDP estimate(or gdp_md_est). However, to show how easily data can be filtered in or out in pandas, let's filter out all continents except Asia. 

Python3
worldfiltered = world[world.continent == "Asia"] worldfiltered.plot(column ='gdp_md_est', cmap ='Reds') 
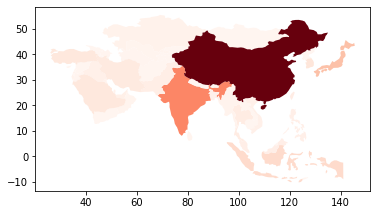
GDP of Countries in Asia

cmap property is used to plot the data in the shade specified. The darker shades mean higher value while the lighter shades means lower value. Now, let's analyse the data for population estimate(pop_est).

Python3
world.plot(column ='pop_est') 

Output:

Population Estimate

The above image is not very good in conveying the data. So let's change some properties to make it more comprehensible. First, let's increase the size of the figure and then set an axis for it. We first plot the world map without any data to on the axis and then we overlay the plot with the data on it with the shade red. This way the map is more clear and dark and makes the data more understandable. However, this map is still a little vague and won't tell us what the shades mean.

Python3
fig, ax = plt.subplots(1, figsize =(16, 8)) world.plot(ax = ax, color ='black') world.plot(ax = ax, column ='pop_est', cmap ='Reds') 

Output:

World Population 

Let's import the toolkits that allow us to make dividers within the plot. After this we are going to plot the graph as we did before, but this time we are going to add a facecolor. The facecolor property is going to change the background to a color it is set to(in this case, light blue). Now we need to create a divider for creating the color box within the graph, much like dividers in HTML. We are creating a divider and setting its properties like size, justification etc. 

Then we need to create the color box in the divider we created. So obviously, the highest value in the color box is going to be the highest population in the dataset and the lowest value is going to be zero. 

Python3
from mpl_toolkits.axes_grid1 import make_axes_locatable   fig, ax = plt.subplots(1, figsize =(16, 8),                        facecolor ='lightblue')  world.plot(ax = ax, color ='black') world.plot(ax = ax, column ='pop_est', cmap ='Reds',            edgecolors ='grey')  # axis for the color bar div = make_axes_locatable(ax) cax = div.append_axes("right", size ="3 %", pad = 0.05)  # color bar vmax = world.pop_est.max() mappable = plt.cm.ScalarMappable(cmap ='Reds',                                  norm = plt.Normalize(vmin = 0, vmax = vmax)) cbar = fig.colorbar(mappable, cax)  ax.axis('off') plt.show() 

Output:

World Population

Thus in this article we have seen how we can use GeoPandas to get geospatial data and plot it using Matplotlib. Custom datasets can be used to analyse specific data and city-wise data can also be used. Also, GeoPandas can be used with Open Street Maps, which provides very specific geospatial data(example, streets, hospitals in a city etc., ). The same knowledge can be extended further and can be used for specific statistical and data analysis. 


Next Article
Plotting Geospatial Data using GeoPandas

R

rahulhegde97
Improve
Article Tags :
  • Data Science
  • Write From Home
  • python-utility
  • python
  • Python-projects
Practice Tags :
  • python

Similar Reads

    Plotting Data on Google Map using Python's pygmaps package
    pygmaps is a matplotlib-like interface to generate the HTML and javascript to render all the data users would like on top of Google Maps. Command to install pygmaps : pip install pygmaps (on windows)sudo pip3 install pygmaps (on linix / unix)Code #1 : To create a Base Map. Python # import required p
    3 min read
    Python | Plotting Google Map using gmplot package
    gmplot is a matplotlib-like interface to generate the HTML and javascript to render all the data user would like on top of Google Maps. Command to install gmplot : pip install gmplotCode #1 : To create a Base Map Python # import gmplot package import gmplot # GoogleMapPlotter return Map object # Pas
    2 min read
    Pair plots using Scatter matrix in Pandas
    Checking for collinearity among attributes of a dataset, is one of the most important steps in data preprocessing. A good way to understand the correlation among the features, is to create scatter plots for each pair of attributes. Pandas has a function scatter_matrix(), for this purpose. scatter_ma
    2 min read
    Olympics Data Analysis Using Python
    In this article, we are going to see the Olympics analysis using Python. The modern Olympic Games or Olympics are leading international sports events featuring summer and winter sports competitions in which thousands of athletes from around the world participate in a variety of competitions. The Oly
    4 min read
    How to Install Geopandas in Kaggle
    GeoPandas simplifies working with geospatial data. It extends the functionality of pandas by adding support for geographic objects such as points, lines, and polygons. If you're using Kaggle for your data analysis or machine learning projects, you can easily install and use GeoPandas to handle geosp
    2 min read
geeksforgeeks-footer-logo
Corporate & Communications Address:
A-143, 7th Floor, Sovereign Corporate Tower, Sector- 136, Noida, Uttar Pradesh (201305)
Registered Address:
K 061, Tower K, Gulshan Vivante Apartment, Sector 137, Noida, Gautam Buddh Nagar, Uttar Pradesh, 201305
GFG App on Play Store GFG App on App Store
Advertise with us
  • Company
  • About Us
  • Legal
  • Privacy Policy
  • In Media
  • Contact Us
  • Advertise with us
  • GFG Corporate Solution
  • Placement Training Program
  • Languages
  • Python
  • Java
  • C++
  • PHP
  • GoLang
  • SQL
  • R Language
  • Android Tutorial
  • Tutorials Archive
  • DSA
  • Data Structures
  • Algorithms
  • DSA for Beginners
  • Basic DSA Problems
  • DSA Roadmap
  • Top 100 DSA Interview Problems
  • DSA Roadmap by Sandeep Jain
  • All Cheat Sheets
  • Data Science & ML
  • Data Science With Python
  • Data Science For Beginner
  • Machine Learning
  • ML Maths
  • Data Visualisation
  • Pandas
  • NumPy
  • NLP
  • Deep Learning
  • Web Technologies
  • HTML
  • CSS
  • JavaScript
  • TypeScript
  • ReactJS
  • NextJS
  • Bootstrap
  • Web Design
  • Python Tutorial
  • Python Programming Examples
  • Python Projects
  • Python Tkinter
  • Python Web Scraping
  • OpenCV Tutorial
  • Python Interview Question
  • Django
  • Computer Science
  • Operating Systems
  • Computer Network
  • Database Management System
  • Software Engineering
  • Digital Logic Design
  • Engineering Maths
  • Software Development
  • Software Testing
  • DevOps
  • Git
  • Linux
  • AWS
  • Docker
  • Kubernetes
  • Azure
  • GCP
  • DevOps Roadmap
  • System Design
  • High Level Design
  • Low Level Design
  • UML Diagrams
  • Interview Guide
  • Design Patterns
  • OOAD
  • System Design Bootcamp
  • Interview Questions
  • Inteview Preparation
  • Competitive Programming
  • Top DS or Algo for CP
  • Company-Wise Recruitment Process
  • Company-Wise Preparation
  • Aptitude Preparation
  • Puzzles
  • School Subjects
  • Mathematics
  • Physics
  • Chemistry
  • Biology
  • Social Science
  • English Grammar
  • Commerce
  • World GK
  • GeeksforGeeks Videos
  • DSA
  • Python
  • Java
  • C++
  • Web Development
  • Data Science
  • CS Subjects
@GeeksforGeeks, Sanchhaya Education Private Limited, All rights reserved
We use cookies to ensure you have the best browsing experience on our website. By using our site, you acknowledge that you have read and understood our Cookie Policy & Privacy Policy
Lightbox
Improvement
Suggest Changes
Help us improve. Share your suggestions to enhance the article. Contribute your expertise and make a difference in the GeeksforGeeks portal.
geeksforgeeks-suggest-icon
Create Improvement
Enhance the article with your expertise. Contribute to the GeeksforGeeks community and help create better learning resources for all.
geeksforgeeks-improvement-icon
Suggest Changes
min 4 words, max Words Limit:1000

Thank You!

Your suggestions are valuable to us.

What kind of Experience do you want to share?

Interview Experiences
Admission Experiences
Career Journeys
Work Experiences
Campus Experiences
Competitive Exam Experiences