Pandas Groupby: Summarising, Aggregating, and Grouping data in Python
Last Updated : 29 Aug, 2022
GroupBy is a pretty simple concept. We can create a grouping of categories and apply a function to the categories. It’s a simple concept, but it’s an extremely valuable technique that’s widely used in data science. In real data science projects, you’ll be dealing with large amounts of data and trying things over and over, so for efficiency, we use Groupby concept. Groupby concept is really important because of its ability to summarize, aggregate, and group data efficiently.
Summarize
Summarization includes counting, describing all the data present in data frame. We can summarize the data present in the data frame using describe() method. This method is used to get min, max, sum, count values from the data frame along with data types of that particular column.
- describe(): This method elaborates the type of data and its attributes.
Syntax:
dataframe_name.describe()
- unique(): This method is used to get all unique values from the given column.
Syntax:
dataframe['column_name].unique()
- nunique(): This method is similar to unique but it will return the count the unique values.
Syntax:
dataframe_name['column_name].nunique()
- info(): This command is used to get the data types and columns information
Syntax:
dataframe.info()
- columns: This command is used to display all the column names present in data frame
Syntax:
dataframe.columns
Example:
We are going to analyze the student marks data in this example.
Python3 # importing pandas as pd for using data frame import pandas as pd # creating dataframe with student details dataframe = pd.DataFrame({'id': [7058, 4511, 7014, 7033], 'name': ['sravan', 'manoj', 'aditya', 'bhanu'], 'Maths_marks': [99, 97, 88, 90], 'Chemistry_marks': [89, 99, 99, 90], 'telugu_marks': [99, 97, 88, 80], 'hindi_marks': [99, 97, 56, 67], 'social_marks': [79, 97, 78, 90], }) # display dataframe dataframe Output:

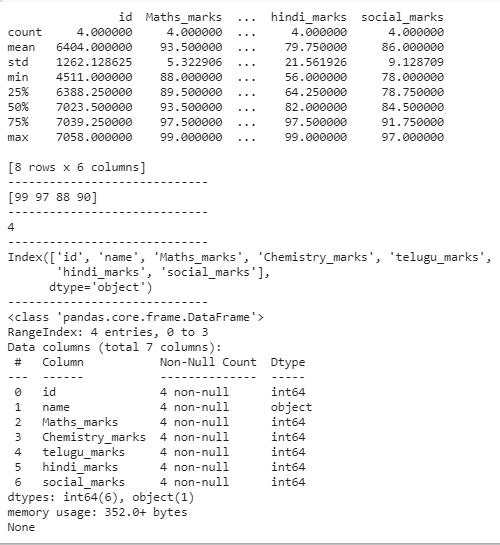
Python3 # describing the data frame print(dataframe.describe()) print("-----------------------------") # finding unique values print(dataframe['Maths_marks'].unique()) print("-----------------------------") # counting unique values print(dataframe['Maths_marks'].nunique()) print("-----------------------------") # display the columns in the data frame print(dataframe.columns) print("-----------------------------") # information about dataframe print(dataframe.info()) Output:
Aggregation
Aggregation is used to get the mean, average, variance and standard deviation of all column in a dataframe or particular column in a data frame.
- sum(): It returns the sum of the data frame
Syntax:
dataframe['column].sum()
- mean(): It returns the mean of the particular column in a data frame
Syntax:
dataframe['column].mean()
- std(): It returns the standard deviation of that column.
Syntax:
dataframe['column].std()
- var(): It returns the variance of that column
dataframe['column'].var()
- min(): It returns the minimum value in column
Syntax:
dataframe['column'].min()
- max(): It returns maximum value in column
Syntax:
dataframe['column'].max()
Example:
In the below program we will aggregate data.
Python3 # importing pandas as pd for using data frame import pandas as pd # creating dataframe with student details dataframe = pd.DataFrame({'id': [7058, 4511, 7014, 7033], 'name': ['sravan', 'manoj', 'aditya', 'bhanu'], 'Maths_marks': [99, 97, 88, 90], 'Chemistry_marks': [89, 99, 99, 90], 'telugu_marks': [99, 97, 88, 80], 'hindi_marks': [99, 97, 56, 67], 'social_marks': [79, 97, 78, 90], }) # display dataframe dataframe Output:
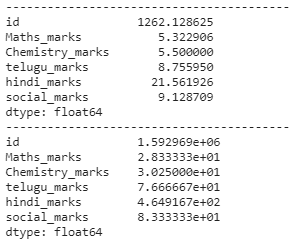
Python3 # getting all minimum values from # all columns in a dataframe print(dataframe.min()) print("-----------------------------------------") # minimum value from a particular # column in a data frame print(dataframe['Maths_marks'].min()) print("-----------------------------------------") # computing maximum values print(dataframe.max()) print("-----------------------------------------") # computing sum print(dataframe.sum()) print("-----------------------------------------") # finding count print(dataframe.count()) print("-----------------------------------------") # computing standard deviation print(dataframe.std()) print("-----------------------------------------") # computing variance print(dataframe.var()) Output:

Grouping
It is used to group one or more columns in a dataframe by using the groupby() method. Groupby mainly refers to a process involving one or more of the following steps they are:
- Splitting: It is a process in which we split data into group by applying some conditions on datasets.
- Applying: It is a process in which we apply a function to each group independently
- Combining: It is a process in which we combine different datasets after applying groupby and results in a data structure
Example 1:
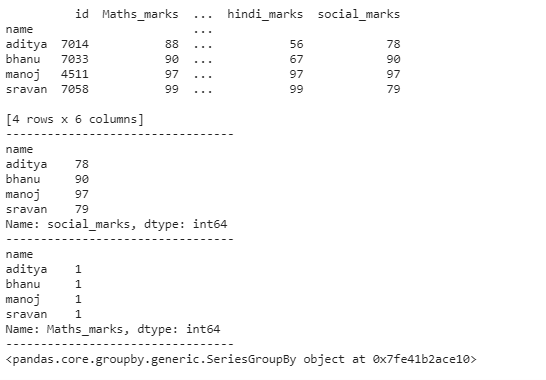
Python3 # importing pandas as pd for using data frame import pandas as pd # creating dataframe with student details dataframe = pd.DataFrame({'id': [7058, 4511, 7014, 7033], 'name': ['sravan', 'manoj', 'aditya', 'bhanu'], 'Maths_marks': [99, 97, 88, 90], 'Chemistry_marks': [89, 99, 99, 90], 'telugu_marks': [99, 97, 88, 80], 'hindi_marks': [99, 97, 56, 67], 'social_marks': [79, 97, 78, 90], }) # group by name print(dataframe.groupby('name').first()) print("---------------------------------") # group by name with social_marks sum print(dataframe.groupby('name')['social_marks'].sum()) print("---------------------------------") # group by name with maths_marks count print(dataframe.groupby('name')['Maths_marks'].count()) print("---------------------------------") # group by name with maths_marks print(dataframe.groupby('name')['Maths_marks']) Output:
Example 2:
Python3 # importing pandas as pd for using data frame import pandas as pd # creating dataframe with student details dataframe = pd.DataFrame({'id': [7058, 4511, 7014, 7033], 'name': ['sravan', 'manoj', 'aditya', 'bhanu'], 'Maths_marks': [99, 97, 88, 90], 'Chemistry_marks': [89, 99, 99, 90], 'telugu_marks': [99, 97, 88, 80], 'hindi_marks': [99, 97, 56, 67], 'social_marks': [79, 97, 78, 90], }) # group by name print(dataframe.groupby('name').first()) print("------------------------") # group by name with social_marks sum print(dataframe.groupby('name')['social_marks'].sum()) print("------------------------") # group by name with maths_marks count print(dataframe.groupby('name')['Maths_marks'].count()) Output:
