Clustering is a fundamental technique in machine learning used to group similar data points together. Traditional clustering methods, such as K-Means, assign each data point to a single cluster, creating well-defined boundaries. However, in many real-world scenarios, data points don’t belong strictly to one cluster but rather exhibit characteristics of multiple clusters simultaneously.
This is where Fuzzy Clustering, based on Fuzzy Logic, making it more suitable for handling uncertainty and overlapping data distributions.
In this article, we’ll explore Fuzzy C-Means (FCM), one of the most widely used fuzzy clustering algorithms, how it works, and how it differs from traditional clustering methods.
If you’re new to clustering, you may want to check out our Introduction to Clustering in Machine Learning before diving into fuzzy clustering
Exploring Fuzzy Clustering in Machine learning
Fuzzy Clustering is a type of clustering algorithm in machine learning that allows a data point to belong to more than one cluster with different degrees of membership. Unlike traditional clustering (like K-Means), where each data point belongs to only one cluster, fuzzy clustering allows a data point to belong to multiple clusters with different membership levels.
Imagine you’re at a party, and guests are casually forming groups based on shared interests like music lovers, food enthusiasts, and sports fans. Some people clearly fit into one group say, a guitarist who only talks about music. But others might belong to multiple groups! A person who enjoys both music and food could be partially in both groups instead of being forced into just one.
How Does Fuzzy Clustering Work?
Fuzzy clustering follows an iterative optimization process where data points are assigned membership values instead of hard cluster labels. Here’s a step-by-step breakdown of how it works:
Step 01: Initialize Membership Values Randomly:
- Each data point is assigned a membership degree for all clusters. These values indicate the probability of the data point belonging to each cluster. Unlike hard clustering (where a point strictly belongs to one cluster), fuzzy clustering allows partial membership.
Let us assume there are 2 clusters in which the data is to be divided, initializing the data point randomly. Each data point lies in both clusters with some membership value which can be assumed anything in the initial state.
The table below represents the values of the data points along with their membership (gamma) in each cluster.
Cluster (1, 3) (2, 5) (4, 8) (7, 9)
1) 0.8 0.7 0.2 0.1
2) 0.2 0.3 0.8 0.9
Step 02: Compute Cluster Centroids:
- The centroids of the clusters are calculated based on the weighted sum of all data points, where weights are determined by membership values. This ensures that points with higher membership contribute more to the centroid.
- The formula for finding out the centroid (V) is:
[Tex]V_{ij} = ( \sum \limits_1^n ( \gamma_{ik}^m * x_k) / \sum \limits_1^n \gamma_{ik}^m [/Tex]
Where, µ is fuzzy membership value of the data point, m is the fuzziness parameter (generally taken as 2), and xk is the data point.
Here,
V11 = (0.8^2 *1 + 0.7^2 * 2 + 0.2^2 * 4 + 0.1^2 * 7) / ( (0.8^2 + 0.7^2 + 0.2^2 + 0.1^2 ) = 1.568
V12 = (0.8^2 *3 + 0.7^2 * 5 + 0.2^2 * 8 + 0.1^2 * 9) / ( (0.8^2 + 0.7^2 + 0.2^2 + 0.1^2 ) = 4.051
V21 = (0.2^2 *1 + 0.3^2 * 2 + 0.8^2 * 4 + 0.9^2 * 7) / ( (0.2^2 + 0.3^2 + 0.8^2 + 0.9^2 ) = 5.35
V22 = (0.2^2 *3 + 0.3^2 * 5 + 0.8^2 * 8 + 0.9^2 * 9) / ( (0.2^2 + 0.3^2 + 0.8^2 + 0.9^2 ) = 8.215
Centroids are: (1.568, 4.051) and (5.35, 8.215)
Step 03: Calculate Distance Between Data Points and Centroids:
- The Euclidean distance (or another distance metric) between each data point and the centroids is computed. This helps in updating the membership values.
D11 = ((1 - 1.568)2 + (3 - 4.051)2)0.5 = 1.2
D12 = ((1 - 5.35)2 + (3 - 8.215)2)0.5 = 6.79
Similarly, the distance of all other points is computed from both the centroids.
Step 04: Update Membership Values:
- The membership values are recalculated based on how close a point is to a centroid relative to the other centroids. The farther a point is from a centroid, the lower its membership value for that cluster.
[Tex]\gamma = \sum \limits_1^n {(d_{ki}^2 /d_{kj}^2)}^{1/m-1} ]^{-1} [/Tex]
For point 1 new membership values are:
[Tex]\gamma_{11} [/Tex]= [{ [(1.2)2 / (1.2)2] + [(1.2)2 / (6.79)2]} ^ {(1 / (2 – 1))} ] -1 = 0.96
[Tex]\gamma_{12} [/Tex]= [{ [(6.79)2 / (6.79)2] + [(6.79)2 / (1.2)2]} ^ {(1 / (2 – 1))} ] -1 = 0.04
Alternatively,
[Tex]\gamma_{12} = 1- \gamma_{11} = 0.04 [/Tex]
Similarly, compute all other membership values, and update the matrix.
Step 05: Repeat Until Convergence:
- Steps 2–4 are repeated until the membership values stabilize, meaning there are no significant changes from one iteration to the next. This indicates that the clustering has reached an optimal state.
Step 06: Defuzzification (Optional):
- In some cases, we may want to convert fuzzy memberships into crisp cluster assignments by assigning each data point to the cluster where it has the highest membership
Implementation of Fuzzy Clustering in Python
The fuzzy scikit learn library has a pre-defined function for fuzzy c-means which can be used in Python. For using fuzzy c-means you need to install the skfuzzy library.
pip install sklearn
pip install scikit-fuzzy
Example :
Python import numpy as np import skfuzzy as fuzz import matplotlib.pyplot as plt np.random.seed(0) data = np.random.rand(2, 100) n_clusters = 3 cntr, u, _, _, _, _, fpc = fuzz.cluster.cmeans( data, c=n_clusters, m=2, error=0.005, maxiter=1000, init=None ) hard_clusters = np.argmax(u, axis=0) print("Cluster Centers:\n", cntr) print("\nFuzzy Membership Matrix (first 5 data points):\n", u[:, :5]) fig, ax = plt.subplots(figsize=(8, 6)) for i in range(n_clusters): ax.scatter(data[0], data[1], c=u[i], alpha=0.6, label=f'Cluster {i+1}') ax.scatter(cntr[:, 0], cntr[:, 1], c='red', marker='X', s=200, label='Cluster Centers') ax.set_title('Fuzzy C-Means Clustering') ax.set_xlabel('Feature 1') ax.set_ylabel('Feature 2') ax.legend() plt.show() output:
Cluster Centers:
[[0.30754645 0.78716007]
[0.26209822 0.24882953]
[0.76385364 0.50704459]]
Fuzzy Membership Matrix (first 5 data points):
[[0.45577541 0.09512042 0.41549568 0.67178149 0.07000059]
[0.12011863 0.20047635 0.10588034 0.0992116 0.8136079 ]
[0.42410596 0.70440323 0.47862398 0.2290069 0.11639152]]
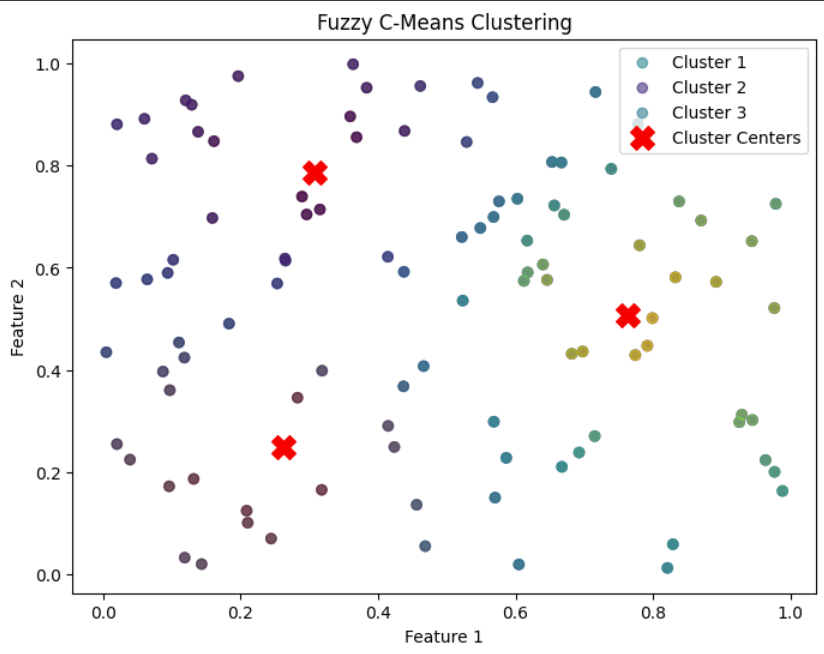
Fuzzy C means Clustering
The plot demonstrates that FCM allows soft clustering, meaning a point can belong to multiple clusters with different probabilities rather than being assigned to just one cluster. This makes it useful when boundaries between clusters are not well-defined and all the Red “X” markers indicate the cluster centers computed by the algorithm.
Advantages of Fuzzy Clustering:
- Flexibility: Fuzzy clustering allows for overlapping clusters, which can be useful when the data has a complex structure or when there are ambiguous or overlapping class boundaries.
- Robustness: Fuzzy clustering can be more robust to outliers and noise in the data, as it allows for a more gradual transition from one cluster to another.
- Interpretability: Fuzzy clustering provides a more nuanced understanding of the structure of the data, as it allows for a more detailed representation of the relationships between data points and clusters.
Disadvantages of Fuzzy Clustering:
- Complexity: Fuzzy clustering algorithms can be computationally more expensive than traditional clustering algorithms, as they require optimization over multiple membership degrees.
- Model selection: Choosing the right number of clusters and membership functions can be challenging, and may require expert knowledge or trial and error.
Conclusion
Fuzzy Clustering, especially Fuzzy C-Means (FCM), provides a more flexible approach by allowing data points to belong to multiple clusters with varying degrees of membership. This is useful when data lacks clear boundaries between clusters. While it offers advantages like robustness to outliers and better handling of complex data, it comes with increased computational complexity. Overall, fuzzy clustering is a valuable technique for problems where traditional clustering methods are insufficient.
Similar Reads
Fuzzy Clustering in R
Clustering is an unsupervised machine-learning technique that is used to identify similarities and patterns within data points by grouping similar points based on their features. These points can belong to different clusters simultaneously. This method is widely used in various fields such as Custom
15+ min read
ML | BIRCH Clustering
Clustering algorithms like K-means clustering do not perform clustering very efficiently and it is difficult to process large datasets with a limited amount of resources (like memory or a slower CPU). So, regular clustering algorithms do not scale well in terms of running time and quality as the siz
3 min read
ML | Mean-Shift Clustering
Meanshift is falling under the category of a clustering algorithm in contrast of Unsupervised learning that assigns the data points to the clusters iteratively by shifting points towards the mode (mode is the highest density of data points in the region, in the context of the Meanshift). As such, it
6 min read
Cluster Sampling in R
Cluster sampling, a widely used technique in statistics and data analysis, offers a practical solution for sampling from large populations. By dividing the population into clusters and selecting a subset of these clusters for analysis, researchers can efficiently collect representative samples while
7 min read
Consensus Clustering
In this article, we'll begin by providing a concise overview of clustering and its prevalent challenges. Subsequently, we'll explore how consensus clustering serves as a solution to mitigate these challenges and delve into interpreting its results. Before learning Consensus Clustering, we must know
7 min read
Supervised Clustering
Clustering is a fundamental technique in unsupervised learning, aiming to group data points into clusters based on their inherent similarities. However, what happens when we blend the principles of clustering with supervised learning? This fusion gives rise to supervised clustering, a hybrid approac
6 min read
Clustering in R Programming
Clustering is an unsupervised learning technique where a dataset is divided into groups, or clusters, based on similarities among data points. It helps identify natural groupings within the data without prior labeling. Each cluster has data points that are closer to one another than to other cluster
5 min read
Spectral Clustering using R
Spectral clustering is a technique used in machine learning and data analysis for grouping data points based on their similarity. The method involves transforming the data into a representation where the clusters become apparent and then using a clustering algorithm on this transformed data. In R Pr
9 min read
K-Mode Clustering in Python
K-mode clustering is an unsupervised machine-learning technique used to group a set of data objects into a specified number of clusters, based on their categorical attributes. The algorithm is called "K-Mode" because it uses modes (i.e. the most frequent values) instead of means or medians to repres
6 min read
Clustering Strings in R
Clustering is a fundamental unsupervised learning technique used to group similar data points together based on their features. While clustering is commonly applied to numerical data, it can also be used to cluster strings or text data. In this article, we'll explore the theory behind clustering str
4 min read