Skip to content
geeksforgeeks
  • Tutorials
    • Python
    • Java
    • Data Structures & Algorithms
    • ML & Data Science
    • Interview Corner
    • Programming Languages
    • Web Development
    • CS Subjects
    • DevOps And Linux
    • School Learning
    • Practice Coding Problems
  • Courses
    • DSA to Development
    • Get IBM Certification
    • Newly Launched!
      • Master Django Framework
      • Become AWS Certified
    • For Working Professionals
      • Interview 101: DSA & System Design
      • Data Science Training Program
      • JAVA Backend Development (Live)
      • DevOps Engineering (LIVE)
      • Data Structures & Algorithms in Python
    • For Students
      • Placement Preparation Course
      • Data Science (Live)
      • Data Structure & Algorithm-Self Paced (C++/JAVA)
      • Master Competitive Programming (Live)
      • Full Stack Development with React & Node JS (Live)
    • Full Stack Development
    • Data Science Program
    • All Courses
  • Data Science
  • Data Science Projects
  • Data Analysis
  • Data Visualization
  • Machine Learning
  • ML Projects
  • Deep Learning
  • NLP
  • Computer Vision
  • Artificial Intelligence
Open In App
Next Article:
Principal Component Analysis with R Programming
Next article icon

ML | Introduction to Kernel PCA

Last Updated : 14 Apr, 2023
Comments
Improve
Suggest changes
Like Article
Like
Report

PRINCIPAL COMPONENT ANALYSIS: is a tool which is used to reduce the dimension of the data. It allows us to reduce the dimension of the data without much loss of information. PCA reduces the dimension by finding a few orthogonal linear combinations (principal components) of the original variables with the largest variance. The first principal component captures most of the variance in the data. The second principal component is orthogonal to the first principal component and captures the remaining variance, which is left of first principal component and so on. There are as many principal components as the number of original variables. These principal components are uncorrelated and are ordered in such a way that the first several principal components explain most of the variance of the original data. To learn more about PCA you can read the article Principal Component Analysis 

KERNEL PCA: PCA is a linear method. That is it can only be applied to datasets which are linearly separable. It does an excellent job for datasets, which are linearly separable. But, if we use it to non-linear datasets, we might get a result which may not be the optimal dimensionality reduction. Kernel PCA uses a kernel function to project dataset into a higher dimensional feature space, where it is linearly separable. It is similar to the idea of Support Vector Machines. There are various kernel methods like linear, polynomial, and gaussian. 

Kernel Principal Component Analysis (KPCA) is a technique used in machine learning for nonlinear dimensionality reduction. It is an extension of the classical Principal Component Analysis (PCA) algorithm, which is a linear method that identifies the most significant features or components of a dataset. KPCA applies a nonlinear mapping function to the data before applying PCA, allowing it to capture more complex and nonlinear relationships between the data points.

In KPCA, a kernel function is used to map the input data to a high-dimensional feature space, where the nonlinear relationships between the data points can be more easily captured by linear methods such as PCA. The principal components of the transformed data are then computed, which can be used for tasks such as data visualization, clustering, or classification.

One of the advantages of KPCA over traditional PCA is that it can handle nonlinear relationships between the input features, which can be useful for tasks such as image or speech recognition. KPCA can also handle high-dimensional datasets with many features by reducing the dimensionality of the data while preserving the most important information.

However, KPCA has some limitations, such as the need to choose an appropriate kernel function and its corresponding parameters, which can be difficult and time-consuming. KPCA can also be computationally expensive for large datasets, as it requires the computation of the kernel matrix for all pairs of data points.

References:

  1. Schölkopf, B., Smola, A., & Müller, K. R. (1998). Nonlinear component analysis as a kernel eigenvalue problem. Neural computation, 10(5), 1299-1319.
  2. Mika, S., Schölkopf, B., Smola, A. J., Müller, K. R., Scholz, M., & Rätsch, G. (1999). Kernel PCA and de-noising in feature spaces. Advances in neural information processing systems, 11, 536-542.
  3. Shawe-Taylor, J., & Cristianini, N. (2004). Kernel methods for pattern analysis. Cambridge University Press.
    Overall, KPCA is a powerful tool for nonlinear dimensionality reduction and feature extraction, but it requires careful consideration of the choice of kernel
  4. function and its parameters. It can be especially useful for high-dimensional datasets with complex relationships between the features.

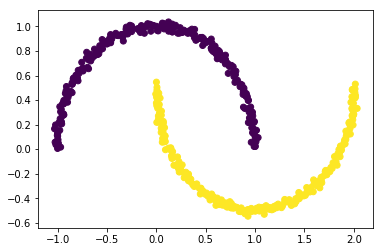
Code: Create a dataset that is nonlinear and then apply PCA to the dataset. 

Python3
import matplotlib.pyplot as plt from sklearn.datasets import make_moons  X, y = make_moons(n_samples=500, noise=0.02, random_state=417)  plt.scatter(X[:, 0], X[:, 1], c=y) plt.show() 

non-linear data 

Code: Let's apply PCA to this dataset.

Python3
from sklearn.decomposition import PCA pca = PCA(n_components=2) X_pca = pca.fit_transform(X)  plt.title("PCA") plt.scatter(X_pca[:, 0], X_pca[:, 1], c=y) plt.xlabel("Component 1") plt.ylabel("Component 2") plt.show() 


As you can see PCA failed to distinguish the two classes.   

Code: Applying kernel PCA on this dataset with RBF kernel with a gamma value of 15. 

Python3
from sklearn.decomposition import KernelPCA kpca = KernelPCA(kernel='rbf', gamma=15) X_kpca = kpca.fit_transform(X)  plt.title("Kernel PCA") plt.scatter(X_kpca[:, 0], X_kpca[:, 1], c=y) plt.show() 


In the kernel space the two classes are linearly separable. Kernel PCA uses a kernel function to project the dataset into a higher-dimensional space, where it is linearly separable. Finally, we applied the kernel PCA to a non-linear dataset using scikit-learn. 

Kernel Principal Component Analysis (PCA) is a technique for dimensionality reduction in machine learning that uses the concept of kernel functions to transform the data into a high-dimensional feature space. In traditional PCA, the data is transformed into a lower-dimensional space by finding the principal components of the covariance matrix of the data. In kernel PCA, the data is transformed into a high-dimensional feature space using a non-linear mapping function, called a kernel function, and then the principal components are found in this high-dimensional space.

Advantages of Kernel PCA:

  1. Non-linearity: Kernel PCA can capture non-linear patterns in the data that are not possible with traditional linear PCA.
  2. Robustness: Kernel PCA can be more robust to outliers and noise in the data, as it considers the global structure of the data, rather than just local distances between data points.
  3. Versatility: Different types of kernel functions can be used in kernel PCA to suit different types of data and different objectives.
  4. Kernel PCA can handle nonlinear relationships between the input features, allowing for more accurate dimensionality reduction and feature extraction compared to traditional linear PCA.
  5. It can preserve the most important information in high-dimensional datasets while reducing the dimensionality of the data, making it easier to visualize and analyze.
  6. Kernel PCA can be used for a variety of tasks, including data visualization, clustering, and classification.
  7. It is a well-established and widely used technique in machine learning, with many available libraries and resources for implementation.

Disadvantages of Kernel PCA:

  1. Complexity: Kernel PCA can be computationally expensive, especially for large datasets, as it requires the calculation of eigenvectors and eigenvalues.
  2. Model selection: Choosing the right kernel function and the right number of components can be challenging and may require expert knowledge or trial and error
  3. Choosing an appropriate kernel function and its parameters can be challenging and may require expert knowledge or extensive experimentation.
  4. Kernel PCA can be computationally expensive, especially for large datasets, as it requires the computation of the kernel matrix for all pairs of data points.
  5. It may not always be easy to interpret the results of kernel PCA, as the transformed data may not have a clear interpretation in the original feature space.
  6. Kernel PCA is not suitable for datasets with many missing values or outliers, as it assumes a complete and consistent dataset.

Next Article
Principal Component Analysis with R Programming

C

codemann
Improve
Article Tags :
  • Machine Learning
  • AI-ML-DS
  • AI-ML-DS With Python
Practice Tags :
  • Machine Learning

Similar Reads

    Machine Learning with R
    Machine Learning as the name suggests is the field of study that allows computers to learn and take decisions on their own i.e. without being explicitly programmed. These decisions are based on the available data that is available through experiences or instructions. It gives the computer that makes
    2 min read

    Getting Started With Machine Learning In R

    Introduction to Machine Learning in R
    Machine learning in R allows data scientists, analysts and statisticians to build predictive models, uncover patterns and gain insights using powerful statistical techniques combined with modern machine learning algorithms. R provides a comprehensive environment with numerous built-in functions and
    6 min read
    What is Machine Learning?
    Machine learning is a branch of artificial intelligence that enables algorithms to uncover hidden patterns within datasets. It allows them to predict new, similar data without explicit programming for each task. Machine learning finds applications in diverse fields such as image and speech recogniti
    9 min read
    Setting up Environment for Machine Learning with R Programming
    Machine Learning is a subset of Artificial Intelligence (AI) which enables systems to learn and make predictions without explicit programming. In machine learning, algorithms and models are developed to identify patterns and trends within data, allowing systems to predict outcomes based on observed
    2 min read
    Supervised and Unsupervised Learning in R Programming
    Machine Learning (ML) is a subset of Artificial Intelligence (AI) that enables computers to learn from data and improve their performance over time without being explicitly programmed. The choice of ML algorithms depends on the type of data and the task at hand which can be broadly divided into Supe
    3 min read

    Data Processing

    Introduction to Data in Machine Learning
    Data refers to the set of observations or measurements to train a machine learning models. The performance of such models is heavily influenced by both the quality and quantity of data available for training and testing. Machine learning algorithms cannot be trained without data. Cutting-edge develo
    4 min read
    ML | Understanding Data Processing
    In machine learning, data is the most important aspect, but the raw data is messy, incomplete, or unstructured. So, we process the raw data to transform it into a clean, structured format for analysis, and this step in the data science pipeline is known as data processing. Without data processing, e
    5 min read
    ML | Overview of Data Cleaning
    Data cleaning is a important step in the machine learning (ML) pipeline as it involves identifying and removing any missing duplicate or irrelevant data. The goal of data cleaning is to ensure that the data is accurate, consistent and free of errors as raw data is often noisy, incomplete and inconsi
    13 min read
    ML | Feature Scaling - Part 1
    Feature Scaling is a technique to standardize the independent features present in the data in a fixed range. It is performed during the data pre-processing. Working: Given a data-set with features- Age, Salary, BHK Apartment with the data size of 5000 people, each having these independent data featu
    3 min read

    Supervised Learning

    Simple Linear Regression in R
    Regression shows a line or curve that passes through all the data points on the target-predictor graph in such a way that the vertical distance between the data points and the regression line is minimum What is Linear Regression?Linear Regression is a commonly used type of predictive analysis. Linea
    12 min read
    Multiple Linear Regression using R
    Prerequisite: Simple Linear-Regression using RLinear Regression: It is the basic and commonly used type for predictive analysis. It is a statistical approach for modeling the relationship between a dependent variable and a given set of independent variables.These are of two types:   Simple linear Re
    3 min read
    Decision Tree for Regression in R Programming
    Decision tree is a type of algorithm in machine learning that uses decisions as the features to represent the result in the form of a tree-like structure. It is a common tool used to visually represent the decisions made by the algorithm. Decision trees use both classification and regression. Regres
    4 min read
    Decision Tree Classifiers in R Programming
    Classification is the task in which objects of several categories are categorized into their respective classes using the properties of classes. A classification model is typically used to, Predict the class label for a new unlabeled data objectProvide a descriptive model explaining what features ch
    4 min read
    Random Forest Approach in R Programming
    Random Forest in R Programming is an ensemble of decision trees. It builds and combines multiple decision trees to get more accurate predictions. It's a non-linear classification algorithm. Each decision tree model is used when employed on its own. An error estimate of cases is made that is not used
    4 min read
    Random Forest Approach for Regression in R Programming
    Random Forest approach is a supervised learning algorithm. It builds the multiple decision trees which are known as forest and glue them together to urge a more accurate and stable prediction. The random forest approach is similar to the ensemble technique called as Bagging. In this approach, multip
    3 min read
    Random Forest Approach for Classification in R Programming
    Random forest approach is supervised nonlinear classification and regression algorithm. Classification is a process of classifying a group of datasets in categories or classes. As random forest approach can use classification or regression techniques depending upon the user and target or categories
    4 min read
    Classifying data using Support Vector Machines(SVMs) in R
    Support Vector Machines (SVM) are supervised learning models mainly used for classification and but can also be used for regression tasks. In this approach, each data point is represented as a point in an n-dimensional space where n is the number of features. The goal is to find a hyperplane that be
    5 min read
    Support Vector Machine Classifier Implementation in R with Caret package
    One of the most crucial aspects of machine learning that most data scientists run against in their careers is the classification problem. The goal of a classification algorithm is to foretell whether a particular activity will take place or not. Depending on the data available, classification algori
    7 min read
    KNN Classifier in R Programming
    K-Nearest Neighbor or KNN is a supervised non-linear classification algorithm. It is also Non-parametric in nature meaning , it doesn't make any assumption about underlying data or its distribution. Algorithm Structure In KNN algorithm, K specifies the number of neighbors and its algorithm is as fol
    4 min read

    Evaluation Metrics

    Precision, Recall and F1-Score using R
    In machine learning, evaluating model performance is critical. Three widely used metrics—Precision, Recall, and F1-Score—help assess the quality of classification models. Here's what each metric represents:Recall: Measures the proportion of actual positive cases correctly identified. Also known as s
    3 min read
    How to Calculate F1 Score in R?
    In this article, we will be looking at the approach to calculate F1 Score using the various packages and their various functionalities in the R language. F1 Score The F-score or F-measure is a measure of a test's accuracy. It is calculated from the precision and recall of the test, where the precisi
    5 min read

    Unsupervised Learning

    K-Means Clustering in R Programming
    K Means Clustering is an unsupervised learning algorithm that groups data into clusters based on similarity. This algorithm divides data into a specified number of clusters, assigning each data point to one. It is used in various fields like banking, healthcare, retail and media. In this article we
    3 min read
    Hierarchical Clustering in R Programming
    Hierarchical clustering in R Programming Language is an Unsupervised non-linear algorithm in which clusters are created such that they have a hierarchy(or a pre-determined ordering). For example, consider a family of up to three generations. A grandfather and mother have their children that become f
    3 min read
    How to Perform Hierarchical Cluster Analysis using R Programming?
    Cluster analysis or clustering is a technique to find subgroups of data points within a data set. The data points belonging to the same subgroup have similar features or properties. Clustering is an unsupervised machine learning approach and has a wide variety of applications such as market research
    5 min read
    Linear Discriminant Analysis in R Programming
    One of the most popular or well established Machine Learning technique is Linear Discriminant Analysis (LDA ). It is mainly used to solve classification problems rather than supervised classification problems. It is basically a dimensionality reduction technique. Using the Linear combinations of pre
    6 min read

    Model Selection and Evaluation

    Cross-Validation in R programming
    The major challenge in designing a machine learning model is to make it work accurately on the unseen data. To know whether the designed model is working fine or not, we have to test it against those data points which were not present during the training of the model. These data points will serve th
    9 min read
    LOOCV (Leave One Out Cross-Validation) in R Programming
    LOOCV (Leave-One-Out Cross-Validation) is a cross-validation technique where each individual observation in the dataset is used once as the validation set, while the remaining observations are used as the training set. This process is repeated for all observations, with each one serving as the valid
    4 min read
    Bias-Variance Trade Off - Machine Learning
    It is important to understand prediction errors (bias and variance) when it comes to accuracy in any machine-learning algorithm. There is a tradeoff between a model’s ability to minimize bias and variance which is referred to as the best solution for selecting a value of Regularization constant. A p
    3 min read

    Reinforcement Learning

    Markov Decision Process
    Markov Decision Process (MDP) is a way to describe how a decision-making agent like a robot or game character moves through different situations while trying to achieve a goal. MDPs rely on variables such as the environment, agent’s actions and rewards to decide the system’s next optimal action. It
    4 min read
    Q-Learning in Reinforcement Learning
    Q-Learning is a popular model-free reinforcement learning algorithm that helps an agent learn how to make the best decisions by interacting with its environment. Instead of needing a model of the environment the agent learns purely from experience by trying different actions and seeing their results
    7 min read
    Deep Q-Learning in Reinforcement Learning
    Deep Q-Learning is a method that uses deep learning to help machines make decisions in complicated situations. It’s especially useful in environments where the number of possible situations called states is very large like in video games or robotics.Before understanding Deep Q-Learning it’s importan
    4 min read

    Dimensionality Reduction

    Introduction to Dimensionality Reduction
    When working with machine learning models, datasets with too many features can cause issues like slow computation and overfitting. Dimensionality reduction helps to reduce the number of features while retaining key information. Techniques like principal component analysis (PCA), singular value decom
    4 min read
    ML | Introduction to Kernel PCA
    PRINCIPAL COMPONENT ANALYSIS: is a tool which is used to reduce the dimension of the data. It allows us to reduce the dimension of the data without much loss of information. PCA reduces the dimension by finding a few orthogonal linear combinations (principal components) of the original variables wit
    6 min read
    Principal Component Analysis with R Programming
    Principal component analysis(PCA) in R programming is an analysis of the linear components of all existing attributes. Principal components are linear combinations (orthogonal transformation) of the original predictor in the dataset. It is a useful technique for EDA(Exploratory data analysis) and al
    3 min read

    Advanced Topics

    Kolmogorov-Smirnov Test in R Programming
    Kolmogorov-Smirnov (K-S) test is a non-parametric test employed to check whether the probability distributions of a sample and a control distribution, or two samples are equal. It is constructed based on the cumulative distribution function (CDF) and calculates the greatest difference between the em
    4 min read
    Moore – Penrose Pseudoinverse in R Programming
    The concept used to generalize the solution of a linear equation is known as Moore – Penrose Pseudoinverse of a matrix. Moore – Penrose inverse is the most widely known type of matrix pseudoinverse. In linear algebra pseudoinverse A^{+}    of a matrix A is a generalization of the inverse matrix. The
    5 min read
    Spearman Correlation Testing in R Programming
    Correlation is a key statistical concept used to measure the strength and direction of the relationship between two variables. Unlike Pearson’s correlation, which assumes a linear relationship and continuous data, Spearman’s rank correlation coefficient is a non-parametric measure that assesses how
    3 min read
    Poisson Functions in R Programming
    The Poisson distribution represents the probability of a provided number of cases happening in a set period of space or time if these cases happen with an identified constant mean rate (free of the period since the ultimate event). Poisson distribution has been named after Siméon Denis Poisson(Frenc
    3 min read
    Feature Engineering in R Programming
    Feature engineering is the process of transforming raw data into features that can be used in a machine-learning model. In R programming, feature engineering can be done using a variety of built-in functions and packages. One common approach to feature engineering is to use the dplyr package to mani
    7 min read
    Adjusted Coefficient of Determination in R Programming
    Prerequisite: Multiple Linear Regression using R A well-fitting regression model produces predicted values close to the observed data values. The mean model, which uses the mean for every predicted value, commonly would be used if there were no informative predictor variables. The fit of a proposed
    3 min read
    Mann Whitney U Test in R Programming
    A popular nonparametric(distribution-free) test to compare outcomes between two independent groups is the Mann Whitney U test. When comparing two independent samples, when the outcome is not normally distributed and the samples are small, a nonparametric test is appropriate. It is used to see the di
    4 min read
    Bootstrap Confidence Interval with R Programming
    Bootstrapping is a statistical method for inference about a population using sample data. It can be used to estimate the confidence interval(CI) by drawing samples with replacement from sample data. Bootstrapping can be used to assign CI to various statistics that have no closed-form or complicated
    5 min read
geeksforgeeks-footer-logo
Corporate & Communications Address:
A-143, 7th Floor, Sovereign Corporate Tower, Sector- 136, Noida, Uttar Pradesh (201305)
Registered Address:
K 061, Tower K, Gulshan Vivante Apartment, Sector 137, Noida, Gautam Buddh Nagar, Uttar Pradesh, 201305
GFG App on Play Store GFG App on App Store
Advertise with us
  • Company
  • About Us
  • Legal
  • Privacy Policy
  • In Media
  • Contact Us
  • Advertise with us
  • GFG Corporate Solution
  • Placement Training Program
  • Languages
  • Python
  • Java
  • C++
  • PHP
  • GoLang
  • SQL
  • R Language
  • Android Tutorial
  • Tutorials Archive
  • DSA
  • Data Structures
  • Algorithms
  • DSA for Beginners
  • Basic DSA Problems
  • DSA Roadmap
  • Top 100 DSA Interview Problems
  • DSA Roadmap by Sandeep Jain
  • All Cheat Sheets
  • Data Science & ML
  • Data Science With Python
  • Data Science For Beginner
  • Machine Learning
  • ML Maths
  • Data Visualisation
  • Pandas
  • NumPy
  • NLP
  • Deep Learning
  • Web Technologies
  • HTML
  • CSS
  • JavaScript
  • TypeScript
  • ReactJS
  • NextJS
  • Bootstrap
  • Web Design
  • Python Tutorial
  • Python Programming Examples
  • Python Projects
  • Python Tkinter
  • Python Web Scraping
  • OpenCV Tutorial
  • Python Interview Question
  • Django
  • Computer Science
  • Operating Systems
  • Computer Network
  • Database Management System
  • Software Engineering
  • Digital Logic Design
  • Engineering Maths
  • Software Development
  • Software Testing
  • DevOps
  • Git
  • Linux
  • AWS
  • Docker
  • Kubernetes
  • Azure
  • GCP
  • DevOps Roadmap
  • System Design
  • High Level Design
  • Low Level Design
  • UML Diagrams
  • Interview Guide
  • Design Patterns
  • OOAD
  • System Design Bootcamp
  • Interview Questions
  • Inteview Preparation
  • Competitive Programming
  • Top DS or Algo for CP
  • Company-Wise Recruitment Process
  • Company-Wise Preparation
  • Aptitude Preparation
  • Puzzles
  • School Subjects
  • Mathematics
  • Physics
  • Chemistry
  • Biology
  • Social Science
  • English Grammar
  • Commerce
  • World GK
  • GeeksforGeeks Videos
  • DSA
  • Python
  • Java
  • C++
  • Web Development
  • Data Science
  • CS Subjects
@GeeksforGeeks, Sanchhaya Education Private Limited, All rights reserved
We use cookies to ensure you have the best browsing experience on our website. By using our site, you acknowledge that you have read and understood our Cookie Policy & Privacy Policy
Lightbox
Improvement
Suggest Changes
Help us improve. Share your suggestions to enhance the article. Contribute your expertise and make a difference in the GeeksforGeeks portal.
geeksforgeeks-suggest-icon
Create Improvement
Enhance the article with your expertise. Contribute to the GeeksforGeeks community and help create better learning resources for all.
geeksforgeeks-improvement-icon
Suggest Changes
min 4 words, max Words Limit:1000

Thank You!

Your suggestions are valuable to us.

What kind of Experience do you want to share?

Interview Experiences
Admission Experiences
Career Journeys
Work Experiences
Campus Experiences
Competitive Exam Experiences