Latent Dirichlet Allocation
Last Updated : 06 Jun, 2021
Topic Modeling:
Topic modeling is a way of abstract modeling to discover the abstract 'topics' that occur in the collections of documents. The idea is that we will perform unsupervised classification on different documents, which find some natural groups in topics. We can answer the following question using topic modeling.
- What is the topic/main idea of the document?
- Given a document, can we find another document with a similar topic?
- How do topics field change over time?
Topic modeling can help in optimizing the search process. In this article, we will be discussing Latent Dirichlet Allocation, a topic modeling process.
Latent Dirichlet Allocation
Latent Dirichlet allocation is one of the most popular methods for performing topic modeling. Each document consists of various words and each topic can be associated with some words. The aim behind the LDA to find topics that the document belongs to, on the basis of words contains in it. It assumes that documents with similar topics will use a similar group of words. This enables the documents to map the probability distribution over latent topics and topics are probability distribution.
Setting up Generative Model:
- Let's suppose we have D documents using the vocabulary of V-word types. Each document consists of an N-words token (can be removed or padded ). Now, we assume K topics, this required a K-dimensional vector that represents the topic distribution for the document.
- Each topic has a V-dimensional multinomial beta_k over words with a common symmetric prior.
- For each topic 1...k:
- Draw a multinomial over words \varphi \sim Dir(\beta) .
- For each document 1...d:
- Draw a multinomial over topics \theta \sim Dir(\alpha)
- For each word w_{N_d} :
- Draw a topic Z_{N_d} \sim Mult(\theta_D) with Z_{N_d} \epsilon [1..K]
- Draw a word W_{N_d} \sim Mult(\varphi).
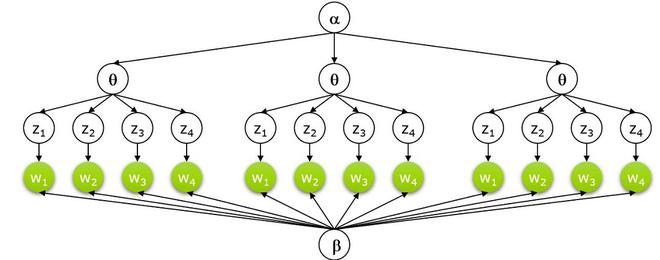
Graphical Model of LDA:

P(W,Z,\theta,\varphi, \alpha, \beta) = \prod_{j=1}^{M} P(\theta_j ; \alpha) \prod_{i=1}^{K} P(\varphi_i ; \beta) \prod_{t=1}^{N} P(Z_{j,t} | \theta_j) P(W_{j,t} | \varphi_{Z_{j,t}})
D: \, Number \, of \, Documents \\ N_d: \, Number \, of \, words \, in \, a \, given \, document \\ \beta: \, dirichlet \, prior \, on \, the\, per-document \, topic\, distribution\\ \alpha: \, dirichlet \, prior \, on \, the\, per-topic \, word\, distribution\\ \theta_i : \, topic \, distribution \, for \, document \, i \\ \varphi_k: \, word \, distribution \, for \, topic \, k \\ z_{ij}: \, topic \, for \, the \, j-th \, word \, in \, document \, i \\ w_{ij}: \, specific \, word.
- In the above equation, the LHS represents the probability of generating the original document from the LDA machine.
- On the right side of the equation, there are 4 probability terms, the first two terms represent Dirichlet distribution and the other two represent the multinomial distribution. The first and third terms represent the distribution of topics but the second and fourth represent the word distribution. We will discuss the Dirichlet distribution first.
Dirichlet Distribution
- Dirichlet's distribution can be defined as a probability density for a vector-valued input having the same characteristics as our multinomial parameter \theta . It has non-zero values such that:
x_1, x_2, ....,x_k \\ where \, x_i \, \epsilon \, (0,1) \, \, \sum_{i=1}^{K}x_i =1
Dir(\theta| \alpha) = \frac{1}{Beta(\alpha)}\prod_{i=1}^{K} \theta_i^{\alpha_i -1} \\ ; where Beta(\alpha) = \frac{\prod_{i=1}^{K} \Gamma(\alpha_i)}{\Gamma(\sum_{i=1}^{K}\alpha_i)} where \alpha =(\alpha_1, \alpha_2,...\alpha_k )
- The Dirichlet distribution is parameterized by the vector α, which has the same number of elements K as the multinomial parameter θ.
- We can interpret p(θ|α) as answering the question "what is the probability density associated with multinomial distribution θ, given that our Dirichlet distribution has parameter α?".
 Dirichlet distribution
- Above is the visualization of the Dirichlet distribution, for our purpose, we can assume that corners/vertices represent the topics with words inside the triangle (the word is closer to the topic if it frequently relates with it. ) or vice-versa.
- This distribution can be extended to more than 3-dimensions. For 4-dimension we can use tetrahedron and for further dimension. We can use k-1 dimensions simplex.
Inference:
- The inference problem in LDA to compute the posterior of the hidden variables given the document and corpus parameter \alpha and \beta. That is to compute the P(
Example:
- Let's consider we have two categories of topics, we have a word vector for each topic consisting of some words. Following are the words that represented different topics:
| words | P(words | topic =1) | P(words | topic =2) |
|---|
| Heart | 0.2 | 0 |
| Love | 0.2 | 0 |
| Soul | 0.2 | 0 |
| Tears | 0.2 | 0 |
| Joy | 0.2 | 0 |
| Scientific | 0 | 0.2 |
| Knowledge | 0 | 0.2 |
| Work | 0 | 0.2 |
| Research | 0 | 0.2 |
| Mathematics | 0 | 0.2 |
- Now, we have some document, and we scan some documents for these words:
| Words in Document | {P(topic=1), P(topic=2)} |
|---|
| MATHEMATICS KNOWLEDGE RESEARCH WORK MATHEMATICS RESEARCH WORK SCIENTIFIC MATHEMATICS WORK | {1,0} |
| SCIENTIFIC KNOWLEDGE MATHEMATICS SCIENTIFIC HEART LOVE TEARS KNOWLEDGE HEART | {0.25, 0.75} |
| MATHEMATICS HEART RESEARCH LOVE MATHEMATICS WORK TEARS SOUL KNOWLEDGE HEART | {0.5, 0.5} |
| WORK JOY SOUL TEARS MATHEMATICS TEARS LOVE LOVE LOVE SOUL | {0.75, 0.25} |
| TEARS LOVE JOY SOUL LOVE TEARS SOUL SOUL TEARS JOY | {1,0} |
- Now, we update the above words to topics matrix using the probabilities from document matrix below.
Implementation
In this implementation, we use scikit-learn and pyLDAvis. For datasets, we use yelp reviews datasets that can be found on the Yelp website.
Python3 # install pyldavis !pip install pyldavis # imports !pip install gensim pyLDAvis ! python3 -m spacy download en_core_web_sm import pandas as pd import numpy as np import string import spacy import nltk import gensim from gensim import corpora import matplotlib.pyplot as plt import pyLDAvis import pyLDAvis.gensim_models nltk.download('wordnet') from nltk.corpus import wordnet as wn nltk.download('stopwords') from nltk.corpus import stopwords import spacy.cli spacy.cli.download("en_core_web_md") import en_core_web_md # fetch yelp review dataset and clean it yelp_review = pd.read_csv('/content/yelp.csv') yelp_review.head() # print number of document and topics print(len(yelp_review)) print("Unique Business") print(len(yelp_review.groupby('business_id'))) print("Unique User") print(len(yelp_review.groupby('user_id'))) # clean the document and remove punctuation def clean_text(text): delete_dict = {sp_char: '' for sp_char in string.punctuation} delete_dict[' '] =' ' table = str.maketrans(delete_dict) text1 = text.translate(table) textArr= text1.split() text2 = ' '.join([w for w in textArr if ( not w.isdigit() and ( not w.isdigit() and len(w)>3))]) return text2.lower() yelp_review['text'] = yelp_review['text'].apply(clean_text) yelp_review['Num_words_text'] = yelp_review['text'].apply(lambda x:len(str(x).split())) print('-------Reviews By Stars --------') print(yelp_review['stars'].value_counts()) print(len(yelp_review)) print('-------------------------') max_review_data_sentence_length = yelp_review['Num_words_text'].max() # print short review ( mask = (yelp_review['Num_words_text'] < 100) & (yelp_review['Num_words_text'] >=20) df_short_reviews = yelp_review[mask] df_sampled = df_short_reviews.groupby('stars') .apply(lambda x: x.sample(n=100)).reset_index(drop = True) print('No of Short reviews') print(len(df_short_reviews)) # function to remove stopwords def remove_stopwords(text): textArr = text.split(' ') rem_text = " ".join([i for i in textArr if i not in stop_words]) return rem_text # remove stopwords from the text stop_words = stopwords.words('english') df_sampled['text']=df_sampled['text'].apply(remove_stopwords) # perform Lemmatization lp = en_core_web_md.load(disable=['parser', 'ner']) def lemmatization(texts,allowed_postags=['NOUN', 'ADJ']): output = [] for sent in texts: doc = nlp(sent) output.append([token.lemma_ for token in doc if token.pos_ in allowed_postags ]) return output text_list=df_sampled['text'].tolist() print(text_list[2]) tokenized_reviews = lemmatization(text_list) print(tokenized_reviews[2]) # convert to document term frequency: dictionary = corpora.Dictionary(tokenized_reviews) doc_term_matrix = [dictionary.doc2bow(rev) for rev in tokenized_reviews] # Creating the object for LDA model using gensim library LDA = gensim.models.ldamodel.LdaModel # Build LDA model lda_model = LDA(corpus=doc_term_matrix, id2word=dictionary, num_topics=10, random_state=100, chunksize=1000, passes=50,iterations=100) # print lda topics with respect to each word of document lda_model.print_topics() # calculate perplexity and coherence print('\Perplexity: ', lda_model.log_perplexity(doc_term_matrix, total_docs=10000)) # calculate coherence coherence_model_lda = CoherenceModel(model=lda_model, texts=tokenized_reviews, dictionary=dictionary , coherence='c_v') coherence_lda = coherence_model_lda.get_coherence() print('Coherence: ', coherence_lda) # Now, we use pyLDA vis to visualize it pyLDAvis.sklearn.prepare(lda_tf, dtm_tf, tf_vectorizer) Total reviews 10000 Unique Business 4174 Unique User 6403 -------------- -------Reviews by stars -------- 4 3526 5 3337 3 1461 2 927 1 749 Name: stars, dtype: int64 10000 ------------------------- No of Short reviews 6276 ------------------------- # review and tokenized version decided completely write place three times tried closed website posted hours open wants drive suburbs youd better call first place cannot trusted wasted time spent hungry minutes walking disappointed vitamin fail said ['place', 'time', 'closed', 'website', 'hour', 'open', 'drive', 'suburb', 'first', 'place', 'time', 'hungry', 'minute', 'vitamin'] --------------------------- # LDA print topics [(0, '0.015*"food" + 0.013*"good" + 0.010*"gelato" + 0.008*"sandwich" + 0.008*"chocolate" + 0.005*"wife" + 0.005*"next" + 0.005*"bad" + 0.005*"night" + 0.005*"sauce"'), (1, '0.030*"food" + 0.021*"great" + 0.019*"place" + 0.019*"good" + 0.016*"service" + 0.011*"time" + 0.011*"nice" + 0.008*"lunch" + 0.008*"dish" + 0.007*"staff"'), (2, '0.023*"food" + 0.023*"good" + 0.018*"place" + 0.014*"great" + 0.009*"star" + 0.009*"service" + 0.008*"store" + 0.007*"salad" + 0.007*"well" + 0.006*"pizza"'), (3, '0.035*"good" + 0.025*"place" + 0.023*"food" + 0.020*"time" + 0.015*"service" + 0.012*"great" + 0.009*"friend" + 0.008*"table" + 0.008*"chicken" + 0.007*"hour"'), (4, '0.020*"food" + 0.019*"time" + 0.012*"good" + 0.009*"restaurant" + 0.009*"great" + 0.008*"service" + 0.007*"order" + 0.006*"small" + 0.006*"hour" + 0.006*"next"'), (5, '0.012*"drink" + 0.009*"star" + 0.006*"worth" + 0.006*"place" + 0.006*"friend" + 0.005*"great" + 0.005*"kid" + 0.005*"drive" + 0.005*"simple" + 0.005*"experience"'), (6, '0.024*"place" + 0.015*"time" + 0.012*"food" + 0.011*"price" + 0.009*"good" + 0.009*"great" + 0.009*"kid" + 0.008*"staff" + 0.008*"nice" + 0.007*"happy"'), (7, '0.028*"place" + 0.019*"service" + 0.015*"good" + 0.014*"pizza" + 0.014*"time" + 0.013*"food" + 0.013*"great" + 0.011*"well" + 0.009*"order" + 0.007*"price"'), (8, '0.032*"food" + 0.026*"good" + 0.026*"place" + 0.015*"great" + 0.009*"service" + 0.008*"time" + 0.006*"price" + 0.006*"meal" + 0.006*"shop" + 0.006*"coffee"'), (9, '0.020*"food" + 0.014*"place" + 0.011*"meat" + 0.010*"line" + 0.009*"good" + 0.009*"minute" + 0.008*"time" + 0.008*"chicken" + 0.008*"wing" + 0.007*"hour"')] ------------------------------
 PyLDAvis Visualization
 Similar Reads
Machine Learning Algorithms Machine learning algorithms are essentially sets of instructions that allow computers to learn from data, make predictions, and improve their performance over time without being explicitly programmed. Machine learning algorithms are broadly categorized into three types: Supervised Learning: Algorith
8 min read
Top 15 Machine Learning Algorithms Every Data Scientist Should Know in 2025 Machine Learning (ML) Algorithms are the backbone of everything from Netflix recommendations to fraud detection in financial institutions. These algorithms form the core of intelligent systems, empowering organizations to analyze patterns, predict outcomes, and automate decision-making processes. Wi
14 min read
Linear Model Regression
Ordinary Least Squares (OLS) using statsmodelsOrdinary Least Squares (OLS) is a widely used statistical method for estimating the parameters of a linear regression model. It minimizes the sum of squared residuals between observed and predicted values. In this article we will learn how to implement Ordinary Least Squares (OLS) regression using P
3 min read
Linear Regression (Python Implementation)Linear regression is a statistical method that is used to predict a continuous dependent variable i.e target variable based on one or more independent variables. This technique assumes a linear relationship between the dependent and independent variables which means the dependent variable changes pr
14 min read
Multiple Linear Regression using Python - MLLinear regression is a statistical method used for predictive analysis. It models the relationship between a dependent variable and a single independent variable by fitting a linear equation to the data. Multiple Linear Regression extends this concept by modelling the relationship between a dependen
4 min read
Polynomial Regression ( From Scratch using Python )Prerequisites Linear RegressionGradient DescentIntroductionLinear Regression finds the correlation between the dependent variable ( or target variable ) and independent variables ( or features ). In short, it is a linear model to fit the data linearly. But it fails to fit and catch the pattern in no
5 min read
Bayesian Linear RegressionLinear regression is based on the assumption that the underlying data is normally distributed and that all relevant predictor variables have a linear relationship with the outcome. But In the real world, this is not always possible, it will follows these assumptions, Bayesian regression could be the
10 min read
How to Perform Quantile Regression in PythonIn this article, we are going to see how to perform quantile regression in Python. Linear regression is defined as the statistical method that constructs a relationship between a dependent variable and an independent variable as per the given set of variables. While performing linear regression we a
4 min read
Isotonic Regression in Scikit LearnIsotonic regression is a regression technique in which the predictor variable is monotonically related to the target variable. This means that as the value of the predictor variable increases, the value of the target variable either increases or decreases in a consistent, non-oscillating manner. Mat
6 min read
Stepwise Regression in PythonStepwise regression is a method of fitting a regression model by iteratively adding or removing variables. It is used to build a model that is accurate and parsimonious, meaning that it has the smallest number of variables that can explain the data. There are two main types of stepwise regression: F
6 min read
Least Angle Regression (LARS)Regression is a supervised machine learning task that can predict continuous values (real numbers), as compared to classification, that can predict categorical or discrete values. Before we begin, if you are a beginner, I highly recommend this article. Least Angle Regression (LARS) is an algorithm u
3 min read
Linear Model Classification
Regularization
K-Nearest Neighbors (KNN)
Support Vector Machines
ML - Stochastic Gradient Descent (SGD) Stochastic Gradient Descent (SGD) is an optimization algorithm in machine learning, particularly when dealing with large datasets. It is a variant of the traditional gradient descent algorithm but offers several advantages in terms of efficiency and scalability, making it the go-to method for many d
8 min read
Decision Tree
Ensemble Learning