Continuous Probability Distributions for Machine Learning
Last Updated : 05 Aug, 2024
Machine learning relies heavily on probability distributions because they offer a framework for comprehending the uncertainty and variability present in data. Specifically, for a given dataset, continuous probability distributions express the chance of witnessing continuous outcomes, like real numbers.
What are Continuous Probability Distributions (CPDs)?
A probability distribution is a mathematical function that describes the likelihood of different outcomes for a random variable. Continuous probability distributions (CPDs) are probability distributions that apply to continuous random variables. It describes events that can take on any value within a specific range, like the height of a person or the amount of time it takes to complete a task.
In continuous probability distributions, two key functions describe the likelihood of a variable taking on specific values:
The PDF gives the probability density at a specific point or interval for a continuous random variable. It indicates how likely the variable is to fall within a small interval around a particular value.
- The height of the PDF curve at any point represents the probability density at that value.
- Higher density implies a higher probability of the variable taking on values around that point.
Cumulative Distribution Function (CDF):
The CDF gives the probability that a random variable is less than or equal to a specific value.It provides a cumulative view of the probability distribution, starting at 0 and increasing to 1 as the value of the random variable increases.
- The CDF starts at 0 for the smallest possible value of the random variable (since there is no probability below this value) and approaches 1 as the value approaches infinity (since the probability of the variable being less than or equal to infinity is 1).
CDF is the integral of the PDF, and the PDF is the derivative of the CDF.
 Difference between PDF and CDF in Continuous Probability Distributions
Why are Continuous Probability Distribution important in machine learning?
Imagine trying to build a model to predict the price of a car. You have data on various factors like mileage, year, and brand. But how do you account for the fact that prices can vary continuously? This is where continuous distributions come to the rescue! By fitting a suitable distribution to the price data, you can estimate the probability of a car with specific features falling within a certain price range.
Types of Continuous Probability Distributions
Here are some common types used in Machine learning,
Normal Distribution (Bell Curve) or Gaussian Distribution:
The Normal Distribution, sometimes referred to as the Gaussian Distribution, is a bell-shaped, symmetrical basic continuous probability distribution. Two factors define it: the standard deviation (σ), which indicates the distribution's spread or dispersion, and the mean (μ), which establishes the distribution's
- Parameters: Mean (μ) and standard deviation (σ)
For a random variable x, it is expressed as,
f(x) =\frac{1}{\sqrt{2 \pi \sigma^2}} \exp \left( -\frac{1}{2} \left( \frac{x - \mu}{\sigma} \right)^2 \right)
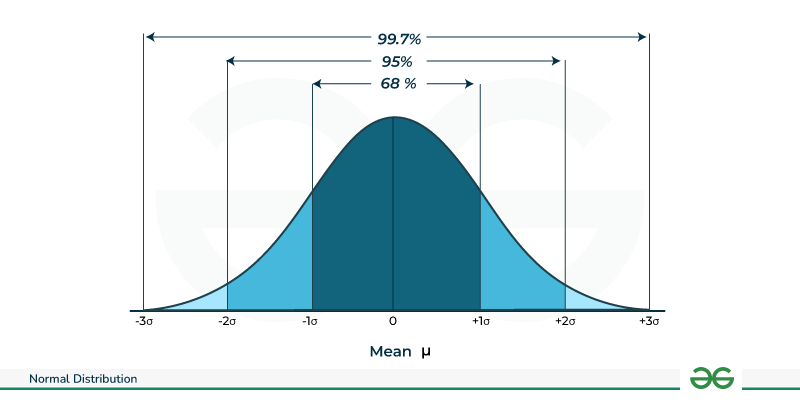
Note: The shape of the Normal Distribution is such that about 68% of the values fall within one standard deviation of the mean (μ ± σ), about 95% fall within two standard deviations (μ ± 2σ), and about 99.7% fall within three standard deviations (μ ± 3σ).
Uniform Distribution:
The Uniform Distribution is a continuous probability distribution where all values within a specified range are equally likely to occur.
- Parameters: Lower bound (a) and upper bound (b).
- The mean of a uniform distribution is \mu = \frac{a + b}{2} and the variance is \sigma^2 = \frac{(b - a)^2}{12}
It is expressed as:
f(x) = \frac{1}{b - a} \quad \text{for } a \leq x \leq b

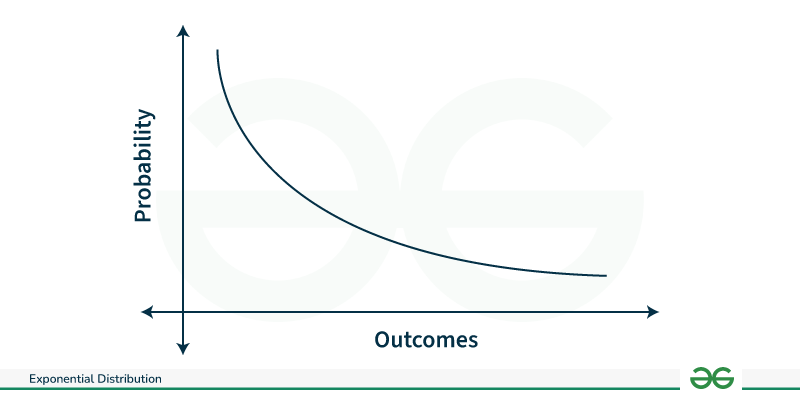
Exponential Distribution:
The exponential distribution is a continuous probability distribution that represents the duration between occurrences in a Poisson process, which occurs continuously and independently at a constant average rate.
- Parameter: Rate parameter (λ).
- The mean of the exponential distribution is 1/λ, and the variance is 1/λ^2.
For a random variable x, it is expressed as
f(x) = \lambda e^{-\lambda x} \quad \text{for } x \geq 0
Chi-Squared Distribution:
The Chi-Squared Distribution is a continuous probability distribution that arises in statistics, particularly in hypothesis testing and confidence interval estimation.
- It is characterized by a single parameter, often denoted as k ,which represents the degrees of freedom.
- The mean of the Chi-Squared Distribution is k and the variance is 2k.
For a random variable x, it is expressed as
f(x) = \frac{1}{2^{k/2} \Gamma(k/2)} \left( \frac{x}{2} \right)^{k/2 - 1} e^{-x/2}
.png)
Determining the distribution of a variable
Example :
Consider the iris dataset and let us try to understand how the petal length is distributed, here are the steps to be considered
Execute on jupyter notebook or any other ide that supports libraries
Python import pandas as pd import numpy as np import matplotlib.pyplot as plt from scipy.stats import norm # loading normal distribution # Step 1: Load the Iris dataset url = "https://raw.githubusercontent.com/uiuc-cse/data-fa14/gh-pages/data/iris.csv" iris_data = pd.read_csv(url) # Step 2: Select the feature for analysis (e.g., petal length) selected_feature = 'petal_length' selected_data = iris_data[selected_feature] # Step 3: Plot the histogram of the selected feature plt.figure(figsize=(12, 5)) plt.subplot(1, 2, 1) plt.hist(selected_data, bins=30, density=True, color='skyblue', alpha=0.6) plt.title('Histogram of {}'.format(selected_feature)) plt.xlabel(selected_feature) plt.ylabel('Density') plt.grid(True) # Step 4: Fit a Gaussian distribution to the selected feature estimated_mean, estimated_std = np.mean(selected_data), np.std(selected_data) # Step 5: Plot the histogram along with the fitted Gaussian distribution plt.subplot(1, 2, 2) plt.hist(selected_data, bins=30, density=True, color='skyblue', alpha=0.6) x = np.linspace(np.min(selected_data), np.max(selected_data), 100) pdf = norm.pdf(x, estimated_mean, estimated_std) plt.plot(x, pdf, color='red', linestyle='--', linewidth=2) plt.title('Histogram and Fitted Gaussian Distribution of {}'.format(selected_feature)) plt.xlabel(selected_feature) plt.ylabel('Density') plt.legend(['Fitted Gaussian Distribution', 'Histogram']) plt.grid(True) plt.tight_layout() plt.show() Output:

Explanation for the output:
- Histogram: The left side of the image shows a histogram, which is a graphical representation of the distribution of petal lengths. Each bar in the histogram represents a range of petal lengths, and the height of the bar shows how many petals fall within that range. The histogram appears to be roughly bell-shaped, suggesting that the petal lengths are normally distributed.
- Gaussian Distribution: The right side of the image shows a fitted Gaussian distribution, also known as a normal distribution. This is a theoretical curve that represents the probability distribution of a normally distributed variable. We see that there are two blocks of hostogram, It's possible that the data comes from two distinct populations with different petal lengths, resulting in two overlapping normal distributions. This could happen if the sample includes flowers from different varieties or grown under different conditions.
These graphs provide insights into the distribution of petal lengths in the Iris dataset and help us assess whether a Gaussian distribution is a suitable model for representing this data.
Similar Reads
Discrete Probability Distributions for Machine Learning Discrete probability distributions are used as fundamental tools in machine learning, particularly when dealing with data that can only take a finite number of distinct values. These distributions describe the likelihood of each possible outcome for a discrete random variable. Understanding these di
6 min read
Real Life Applications of Continuous Probability Distribution A Continuous Probability Distribution is a statistical concept that describes the probability distribution of a continuous random variable. It specifies the probabilities associated with various outcomes or values that the random variable can take within a specified range.In this article, we'll look
13 min read
Gaussian Distribution In Machine Learning The Gaussian distribution, also known as the normal distribution, plays a fundamental role in machine learning. It is a key concept used to model the distribution of real-valued random variables and is essential for understanding various statistical methods and algorithms.Table of Content Gaussian D
7 min read
Radial Basis Function Kernel - Machine Learning Kernels play a fundamental role in transforming data into higher-dimensional spaces, enabling algorithms to learn complex patterns and relationships. Among the diverse kernel functions, the Radial Basis Function (RBF) kernel stands out as a versatile and powerful tool. In this article, we delve into
6 min read
Probabilistic Models in Machine Learning Machine learning algorithms today rely heavily on probabilistic models, which take into consideration the uncertainty inherent in real-world data. These models make predictions based on probability distributions, rather than absolute values, allowing for a more nuanced and accurate understanding of
6 min read