Grouping and Aggregating with Pandas
Last Updated : 12 May, 2025
When working with large datasets it’s used to group and summarize the data to make analysis easier. Pandas a popular Python library provides powerful tools for this. In this article you’ll learn how to use Pandas’ groupby() and aggregation functions step by step with clear explanations and practical examples.
Aggregation in Pandas
Aggregation means applying a mathematical function to summarize data. It can be used to get a summary of columns in our dataset like getting sum, minimum, maximum etc. from a particular column of our dataset. The function used for aggregation is agg() the parameter is the function we want to perform. Some functions used in the aggregation are:
- sum() : Compute sum of column values
- min() : Compute min of column values
- max() : Compute max of column values
- mean() : Compute mean of column
- size() : Compute column sizes
- describe() : Generates descriptive statistics
- first() : Compute first of group values
- last() : Compute last of group values
- count() : Compute count of column values
- std() : Standard deviation of column
- var() : Compute variance of column
- sem() : Standard error of the mean of column
Creating a Sample Dataset
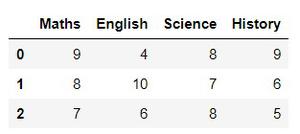
Let’s create a small dataset of student marks in Maths, English, Science and History.
Python import pandas as pd df = pd.DataFrame([[9, 4, 8, 9], [8, 10, 7, 6], [7, 6, 8, 5]], columns=['Maths', 'English', 'Science', 'History']) print(df)
Output:
Now that we have a dataset let’s perform aggregation.
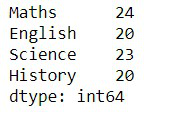
1. Summing Up All Values (sum())
The sum() function adds up all values in each column.
Python Output:
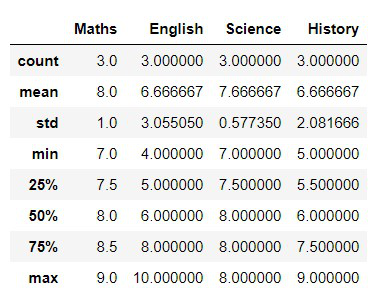
2. Getting a Summary (describe())
Instead of calculating sum, mean, min and max separately we can use describe() which provides all important statistics in one go.
Python Output:
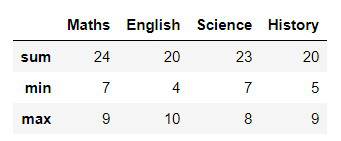
3. Applying Multiple Aggregations at Once (agg())
The .agg() function lets you apply multiple aggregation functions at the same time.
Python df.agg(['sum', 'min', 'max'])
Output:
Grouping in Pandas
Grouping in Pandas means organizing your data into groups based on some columns. Once grouped you can perform actions like finding the total, average, count or even pick the first row from each group. This method follows a split-apply-combine process:
- Split the data into groups
- Apply some calculation like sum, average etc.
- Combine the results into a new table.
Let’s understand grouping in Pandas using a small bakery order dataset as an example.
Python import pandas as pd data = { 'Item': ['Cake', 'Cake', 'Bread', 'Pastry', 'Cake'], 'Flavor': ['Chocolate', 'Vanilla', 'Whole Wheat', 'Strawberry', 'Chocolate'], 'Price': [250, 220, 80, 120, 250] } df = pd.DataFrame(data) print(df) Output:
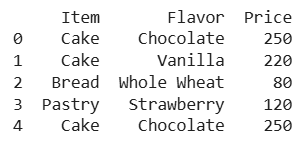
Bakery dataset
Grouping Data by One Column Using groupby()
Let’s say we want to group the orders based on the Item column.
Python grouped = df.groupby('Item') print(grouped) Output:
<pandas.core.groupby.generic.DataFrameGroupBy object at 0x7867484be150>
This doesn’t show the result directly it just creates a grouped object. To actually see the data we need to apply a method like .sum(), .mean() or first(). Let’s find the total price of each item sold:
Python print(df.groupby('Item')['Price'].sum()) Output:
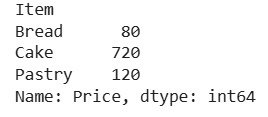
Grouping data by one columns
The above output shows the total earnings from each item.
Grouping by Multiple Columns
Now let’s group by Item and Flavor to see how each flavored item sold.
Python print(df.groupby(['Item', 'Flavor'])['Price'].sum())
Output:
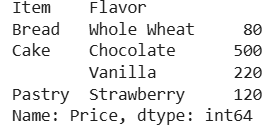
Grouping by multiple columns
The above output show Chocolate Cakes earned ₹500 and Vanilla Cake earned ₹220 and more.
Similar Reads
Groupby without aggregation in Pandas
Pandas is a great python package for manipulating data and some of the tools which we learn as a beginner are an aggregation and group by functions of pandas. Groupby() is a function used to split the data in dataframe into groups based on a given condition. Aggregation on other hand operates on se
4 min read
Pandas Groupby: Summarising, Aggregating, and Grouping data in Python
GroupBy is a pretty simple concept. We can create a grouping of categories and apply a function to the categories. It’s a simple concept, but it’s an extremely valuable technique that’s widely used in data science. In real data science projects, you’ll be dealing with large amounts of data and tryin
5 min read
MongoDB Aggregation $group Command
The $group command in MongoDB's aggregation framework is a powerful tool for performing complex data analysis and summarization. It allows users to group documents based on specified keys and apply aggregate functions such as sum, count, average, min, max, and more. In this article, we will explore
6 min read
Write custom aggregation function in Pandas
Pandas in python in widely used for Data Analysis purpose and it consists of some fine data structures like Dataframe and Series. There are several functions in pandas that proves to be a great help for a programmer one of them is an aggregate function. This function returns a single value from mult
4 min read
Python MongoDB - $group (aggregation)
MongoDB is an open-source document-oriented database. MongoDB stores data in the form of key-value pairs and is a NoSQL database program. The term NoSQL means non-relational. In this article, we will see the use of $group in MongoDB using Python. $group operation In PyMongo, the Aggregate Method is
3 min read
Count distinct in Pandas aggregation
In this article, let's see how we can count distinct in pandas aggregation. So to count the distinct in pandas aggregation we are going to use groupby() and agg() method. Â groupby(): This method is used to split the data into groups based on some criteria. Pandas objects can be split on any of thei
2 min read
Pyspark GroupBy DataFrame with Aggregation or Count
Pyspark is a powerful tool for working with large datasets in a distributed environment using Python. One of the most common tasks in data manipulation is grouping data by one or more columns. This can be accomplished using the groupBy() function in Pyspark, which allows you to group a DataFrame bas
3 min read
Python | Pandas dataframe.aggregate()
Dataframe.aggregate() function is used to apply some aggregation across one or more columns. Aggregate using callable, string, dict or list of string/callables. The most frequently used aggregations are: sum: Return the sum of the values for the requested axismin: Return the minimum of the values fo
2 min read
Pandas Groupby and Sum
It's a simple concept but it's an extremely valuable technique that's widely used in data science. It is helpful in the sense that we can : Compute summary statistics for every groupPerform group-specific transformationsDo the filtration of data The dataframe.groupby() involves a combination of spli
2 min read
Pandas Groupby Average
GroupBy operations are powerful tools for summarizing and aggregating data. One common operation is calculating the average (mean) of groups within a DataFrame. Whether you're analyzing sales data by region, customer behavior by age group, or any other grouped data, groupby() method combined with ag
3 min read