Features of Excel Power Pivot
Last Updated : 23 Jul, 2022
Power pivot is an add-in in excel which can be used to create huge Data models, dissect data across multiple tables and Excel Sheets and analyze that vast amount of data. Power Pivot allows us to perform big data analytics. Power Pivot enables us to import numerous of rows and columns of data from multiple data sources and Excel sheets into one Excel sheet. It forms a relation between these imported data banks and integrates them allowing the user to further analyze the data and perform much more complex functions and calculations that would not have been possible using simple Excel.
Features
Using Power Pivot we can create calculated columns and measures using formulas. We can also represent, visualize and manipulate our data sheets and integrated functions in a graphical way and thus making our Excel much more comprehensive, user-readable, attractive and credible by building PivotTables and Pivot Charts , and further process the data so that we are able to make important decisions fast and correctly. Power Pivot is implemented through DAX (Data Analysis Expressions). Power Pivot combine 2 or more databases and forms an interlink which allows to perform functions and calculations that cannot be done on a single data source alone.
How to use Power pivot
- Create 2 or more separate data storages in Excel sheets which may or may not have data sets of common names but must have same data type (e.g. integer, currency, word, etc).
- Add the COM Add-ins of Power Pivot in the Add-ins section.
- Using Add data model add the existing Excel sheets.
- Create a relationship between the added tables.
- The imported tables will be represented in the diagram view section.
- Click and drag the object of 1 table till the object of another table.
- After doing this our data model is created successfully and now, we can perform operations on this.
- This data can now also be used to make Pivot Graphs and Pivot Pie-charts.
Data Models
Data Models are collection of data (that may be raw or processed) which are generated and structured up using Power Pivot feature of MS - EXCEL . It is a conjoined data table in which 2 or more number of data tables are in an association with one another through shared or mutual data types (can be same column of data or data that is interrelated in the distinct data tables). Data model is established on the grounds of Data, Data limitation and Data association.
DAX : Data Analysis Expressions
DAX is a syntax language that has expressions and formulae that can be used in data manipulation and analysis. DAX expressions are a conjunction of various functions, operators and consonants. Thus DAX is innovative form of MS Excel with high-end data manipulation and management capabilities.
DAX is a formula expression language and for various visualization tools. DAX is named as function language in which code is reserved inside a function. DAX improves the user experience by organizing functions like data visualization, data analysis, data importing, data modelling and manipulating.
DAX programming formula encompasses 2 types of data: Numeric and Others. Numeric contains integers, currency and decimals. Others contains string and binary object.
DAX has certain predefined functions,
- Text
- Date
- Information
- Count
- Aggregate
- Logical
DAX works mixture, pattern and permutation of 3 fundamental concepts:
- Functions
- Syntax
- Context
Step-by-step implementation of power pivot in MS excel
Step 1: Starting Up
Create separate data tables in MS EXCEL that store interrelated data. For this example 3 data tables in separate sheets are constructed, namely Garment.

The Garment Data Sheet contains the name of the Garments and their revenue and cost respectively.
 Customer data sheet
 The Customer Data sheet contains information about the customers. It contains a customer’s respective Name, Phone number, Retailer Id, Address and the city where they are located in.
 Orders Data Sheet
 The Orders Data Sheet contains information about the orders placed by different customers. It contains information that which retailer placed the order through customer ID, the Product they ordered and the number of Units sold.
Step 2: Power Pivot Add-in
- Open Excel
- Select File
- Go to Options
ADD-IN in MS - Excel
Add-in is a software package which allows the user to insert/attach new features in MS- EXCEL. Add-ins can be used to perform complex, repetitious and time taking operations in less time without any errors.
There are 2 types of Add-ins
- EXCEL ADD-INS
- COM ADD-INS
An Excel Add-in comprises of 2 main constituents:
- Web application
- Configuration file
The difference between COM add-ins and EXCEL add-ins is that COM add-ins do not have a prerequisite that a specific software should be installed within the EXCEL, thus can be installed freely.
 File Menu
- Select COM Add-in from the Manage dropdown.
 Add-ins
- Select Go.
- Select Microsoft Power Pivot Excel.
- Select OK. It adds the Power Pivot tab to Excel.
Power Pivot is now successfully added to MS Excel and is available for performing calculations and functions.
 Starting Power Pivot
 Step 3: Data Model
Adding Data tables in the Data Model.
- In the Power Pivot tab click on Manage:
 Manage Data Model
- In Manage -> Get External Data -> From Other Sources
 Table import Wizard
- For selecting any data sheet, Table import wizard box pops up and we can select the desired Excel
 Connecting to Excel file
 Click on next -> tick the e checkbox ‘Use first row as column header ->next> ->Finish
- Repeating the same steps for adding the rest of the data tables
 Order data sheet in Data Model
 Garment types data sheet in Data Model
 Customer details data-sheet in Data Model
 Step 4: Creating a relationship between Data tables

- We can see the different data tables in a diagrammatic way. Click an object you want to relate of one data table and drag it to the object of another data table
 Creating relations in Diagram view
- The categories which have been linked together are now represented as related.
 relation
 Step 5:Performing functions on the created data model
- Using the RELATED keyword to perform calculations that require data from 2 different data tables. Creating 3 new columns : Revenue, Cost, Profit.
 related keyword
- In the Revenue column, we calculate total revenue earned from every order.
 calculate revenue
- The revenue column is calculated for every unique order Id.
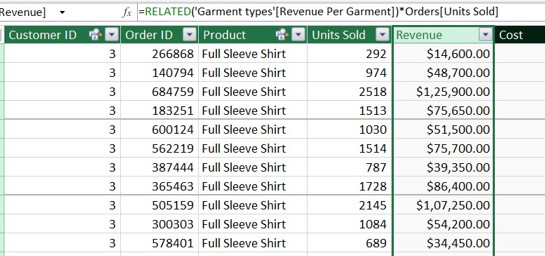 revenue
- We repeat similar steps for calculating Cost. For calculating Profit, subtract Cost from Revenue

- To find the distinct number of customers, use formula DISTINCTCOUNT
 Distinct number of customers
- To find the total profit, use formula SUM
 Total profit
- To calculate the average profit per customer, divide the total profit by no. of customers
 Average profit per customer
 Step 6: Creating Pivot Table
Pivot Table is a statistical tool that is used to form a final linked table based upon the data model constructed between interrelated data tables. Pivot table can be used to execute huge processes and calculations centred on the previously computed data values in the data model. Therefore we can create massive amount of raw data into organized and meaningful reports and allows us to extract this information and thus carry out strategic business decisions.
- Click on Insert -> Pivot Table -> From Data Model->New Worksheet

- Drag and drop the columns from the list of which we have to form a related table.

 pivot table
- Add total profit of respective retailer.


Step 7:Adding KPIs
KPI: Key performance indicators
KPIs are a visual degree of performance. Held by a specific calculated field, a KPI is designed to help users easily evaluate the present value and status of a measure against a fixed target.
 KPIs
KPIs

- We now see that in Pivot Table fields, total profit is now represented with an icon of traffic signal, meaning that the total profit is now a KPI


Step 8: Adding Charts
Pivot Chart permits the user to quickly represent mammoth amount of data in a visually appealing and easy to comprehend graphs and charts, for e.g. columns, pie charts, Bars, Area, Treemap, etc. We can add various kinds of calculated data fields according to our need and customize the graph, like changing the color representation, adding 3d effects , rotating the graph, etc. Pivot Chart is represented on the basis of the data contained inside of the pivot table, hence if we make any change in the pivot table, it will be automatically represented in the pivot chart.
 pivot chart
- Different kinds of charts can be inserted. We use the Pie Chart.


- A pie chart is added and instantaneously the Data representation looks much more interactive and easier to comprehend. In the graph Profit per each customer is displayed, thus it is much clearer that units sold to which retailer led to more profit.

Conclusion
We have discussed what Power Pivot is and how to implement Power Pivot in simple steps through an example.
- We saw how to import the data into the model, create relationships between the existing data tables and then use them in PivotTables. Power Pivot is a tremendously advantageous and handy and powerful tool.
- We can enhance our Business Analytical skills via Power pivot effortlessly carry out decision making process.