Fake News Detection using Machine Learning
Last Updated : 10 Sep, 2024
Fake news on different platforms is spreading widely and is a matter of serious concern, as it causes social wars and permanent breakage of the bonds established among people. A lot of research is already going on focused on the classification of fake news.
Here we will try to solve this issue with the help of machine learning in Python.
Before starting the code, download the dataset by clicking the link.
Steps to be followed
- Importing Libraries and Datasets
- Data Preprocessing
- Preprocessing and analysis of News column
- Converting text into Vectors
- Model training, Evaluation, and Prediction
Importing Libraries and Datasets
The libraries used are :
Python import pandas as pd import seaborn as sns import matplotlib.pyplot as plt
Let's import the downloaded dataset.
Python data = pd.read_csv('News.csv',index_col=0) data.head() Output :

Data preprocessing
The shape of the dataset can be found by the below code.
Python Output:
(44919, 5)
As the title, subject and date column will not going to be helpful in identification of the news. So, we can drop these column.
Python data = data.drop(["title", "subject","date"], axis = 1)
Now, we have to check if there is any null value (we will drop those rows)
Python Output:
text     0
class    0
So there is no null value.
Now we have to shuffle the dataset to prevent the model to get bias. After that we will reset the index and then drop it. Because index column is not useful to us.
Python # Shuffling data = data.sample(frac=1) data.reset_index(inplace=True) data.drop(["index"], axis=1, inplace=True)
Now Let's explore the unique values in the each category using below code.
Python sns.countplot(data=data, x='class', order=data['class'].value_counts().index)
Output:
 unique values in the each category
Preprocessing and analysis of News column
Firstly we will remove all the stopwords, punctuations and any irrelevant spaces from the text. For that NLTK Library is required and some of it's module need to be downloaded. So, for that run the below code.
Python from tqdm import tqdm import re import nltk nltk.download('punkt') nltk.download('stopwords') from nltk.corpus import stopwords from nltk.tokenize import word_tokenize from nltk.stem.porter import PorterStemmer from wordcloud import WordCloud Once we have all the required modules, we can create a function name preprocess text. This function will preprocess all the data given as input.
Python def preprocess_text(text_data): preprocessed_text = [] for sentence in tqdm(text_data): sentence = re.sub(r'[^\w\s]', '', sentence) preprocessed_text.append(' '.join(token.lower() for token in str(sentence).split() if token not in stopwords.words('english'))) return preprocessed_text To implement the function in all the news in the text column, run the below command.
Python preprocessed_review = preprocess_text(data['text'].values) data['text'] = preprocessed_review
This command will take some time (as the dataset taken is very large).
Let's visualize the WordCloud for fake and real news separately.
Python # Real consolidated = ' '.join( word for word in data['text'][data['class'] == 1].astype(str)) wordCloud = WordCloud(width=1600, height=800, random_state=21, max_font_size=110, collocations=False) plt.figure(figsize=(15, 10)) plt.imshow(wordCloud.generate(consolidated), interpolation='bilinear') plt.axis('off') plt.show() Output :
 WordCloud for real news Python
 # Fake consolidated = ' '.join( word for word in data['text'][data['class'] == 0].astype(str)) wordCloud = WordCloud(width=1600, height=800, random_state=21, max_font_size=110, collocations=False) plt.figure(figsize=(15, 10)) plt.imshow(wordCloud.generate(consolidated), interpolation='bilinear') plt.axis('off') plt.show() Output :
 WordCloud for fake news
Now, Let's plot the bargraph of the top 20 most frequent words.
Python from sklearn.feature_extraction.text import CountVectorizer def get_top_n_words(corpus, n=None): vec = CountVectorizer().fit(corpus) bag_of_words = vec.transform(corpus) sum_words = bag_of_words.sum(axis=0) words_freq = [(word, sum_words[0, idx]) for word, idx in vec.vocabulary_.items()] words_freq = sorted(words_freq, key=lambda x: x[1], reverse=True) return words_freq[:n] common_words = get_top_n_words(data['text'], 20) df1 = pd.DataFrame(common_words, columns=['Review', 'count']) df1.groupby('Review').sum()['count'].sort_values(ascending=False).plot( kind='bar', figsize=(10, 6), xlabel="Top Words", ylabel="Count", title="Bar Chart of Top Words Frequency" ) Output :
 bargraph of the top 20 most frequent words
Converting text into Vectors
Before converting the data into vectors, split it into train and test.
Python from sklearn.model_selection import train_test_split from sklearn.metrics import accuracy_score from sklearn.linear_model import LogisticRegression x_train, x_test, y_train, y_test = train_test_split(data['text'], data['class'], test_size=0.25)
Now we can convert the training data into vectors using TfidfVectorizer.
Python from sklearn.feature_extraction.text import TfidfVectorizer vectorization = TfidfVectorizer() x_train = vectorization.fit_transform(x_train) x_test = vectorization.transform(x_test)
Model training, Evaluation, and Prediction
Now, the dataset is ready to train the model.
For training we will use Logistic Regression and evaluate the prediction accuracy using accuracy_score.
Python from sklearn.linear_model import LogisticRegression model = LogisticRegression() model.fit(x_train, y_train) # testing the model print(accuracy_score(y_train, model.predict(x_train))) print(accuracy_score(y_test, model.predict(x_test)))
Output :
0.993766511324171
0.9893143365983972
Let's train with Decision Tree Classifier.
Python from sklearn.tree import DecisionTreeClassifier model = DecisionTreeClassifier() model.fit(x_train, y_train) # testing the model print(accuracy_score(y_train, model.predict(x_train))) print(accuracy_score(y_test, model.predict(x_test)))
Output :
0.9999703167205913
0.9951914514692787
The confusion matrix for Decision Tree Classifier can be implemented with the code below.
Python # Confusion matrix of Results from Decision Tree classification from sklearn import metrics cm = metrics.confusion_matrix(y_test, model.predict(x_test)) cm_display = metrics.ConfusionMatrixDisplay(confusion_matrix=cm, display_labels=[False, True]) cm_display.plot() plt.show()
Output :
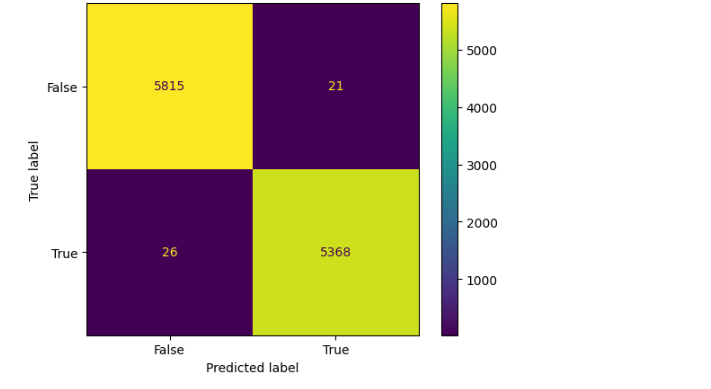 confusion matrix
Get the complete notebook link here:
Colab Link : click here.
Dataset Link : click here.
Conclusion
Decision Tree Classifier and Logistic regression are performing well.
Similar Reads
Online Payment Fraud Detection using Machine Learning in Python As we are approaching modernity, the trend of paying online is increasing tremendously. It is very beneficial for the buyer to pay online as it saves time, and solves the problem of free money. Also, we do not need to carry cash with us. But we all know that Good thing are accompanied by bad things.
5 min read
Machine Learning for Anomaly Detection Anomaly Detection is the technique of identifying rare events or observations which can raise suspicions by being statistically different from the rest of the observations. Such "anomalous" behaviour typically translates to some kind of a problem like a credit card fraud, failing machine in a server
4 min read
Intrusion Detection System Using Machine Learning Algorithms Problem Statement: The task is to build a network intrusion detector, a predictive model capable of distinguishing between bad connections, called intrusions or attacks, and good normal connections. Introduction:Intrusion Detection System is a software application to detect network intrusion using v
11 min read
How to Detect Outliers in Machine Learning In machine learning, an outlier is a data point that stands out a lot from the other data points in a set. The article explores the fundamentals of outlier and how it can be handled to solve machine learning problems.Table of Content What is an outlier?Outlier Detection Methods in Machine LearningTe
6 min read
Fake News Detection Model using TensorFlow in Python Fake news is a type of misinformation that can mislead readers, influence public opinion, and even damage reputations. Detecting fake news prevents its spread and protects individuals and organizations. Media outlets often use these models to help filter and verify content, ensuring that the news sh
5 min read