Exploratory Data Analysis in Python | Set 1
Last Updated : 22 Jan, 2025
This article provides a comprehensive guide to performing Exploratory Data Analysis (EDA) using Python focusing on the use of NumPy and Pandas for data manipulation and analysis.
Step 1: Setting Up Environment
To perform EDA in Python we need to import several libraries that provide powerful tools for data manipulation and statistical analysis.
Python import numpy as np import pandas as pd import seaborn as sns import matplotlib.pyplot as plt from scipy.stats import trim_mean
Step 2: Loading and Inspecting the Dataset
In this step we load a dataset using Pandas and explore its structure. We can check the type of data and print the first and last 10 records to get a idea of the dataset .
Python data = pd.read_csv("state.csv") print ("Type : ", type(data), "\n\n") print ("Head -- \n", data.head(10)) print ("\n Tail -- \n", data.tail(10)) Output :
Type : class 'pandas.core.frame.DataFrame'


Head --
          State  Population  Murder.Rate Abbreviation
0      Alabama     4779736          5.7           AL
1       Alaska      710231          5.6           AK
2      Arizona     6392017          4.7           AZ
3     Arkansas     2915918          5.6           AR
4   California    37253956          4.4           CA
5     Colorado     5029196          2.8           CO
6  Connecticut     3574097          2.4           CT
7     Delaware      897934          5.8           DE
8      Florida    18801310          5.8           FL
9      Georgia     9687653          5.7           GA


 Tail --
             State  Population  Murder.Rate Abbreviation
40   South Dakota      814180          2.3           SD
41      Tennessee     6346105          5.7           TN
42          Texas    25145561          4.4           TX
43           Utah     2763885          2.3           UT
44        Vermont      625741          1.6           VT
45       Virginia     8001024          4.1           VA
46     Washington     6724540          2.5           WA
47  West Virginia     1852994          4.0           WV
48      Wisconsin     5686986          2.9           WI
49        Wyoming      563626          2.7           WY
Step 3: Adding and Modifying Columns
Derived columns are new columns created from existing ones. For example here we are converting the population into millions to make it more readable.
Python data['PopulationInMillions'] = data['Population']/1000000 print (data.head(5))
Output :
        State  Population  Murder.Rate Abbreviation  PopulationInMillions
0     Alabama     4779736          5.7           AL              4.779736
1      Alaska      710231          5.6           AK              0.710231
2     Arizona     6392017          4.7           AZ              6.392017
3    Arkansas     2915918          5.6           AR              2.915918
4  California    37253956          4.4           CA             37.253956
Sometimes, you may need to rename columns when column names contain special characters or spaces which cause issues in data manipulation. To do this we use .rename() function.
Python data.rename(columns ={'Murder.Rate': 'MurderRate'}, inplace = True) list(data) Output :
['State', 'Population', 'MurderRate', 'Abbreviation']
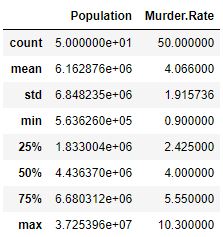
Step 4: Describing the Data
Using describe() provides a summary of the dataset which includes count, mean, standard deviation and more for each numerical column.
Python Output :
The info() method in pandas provides a summary of the dataset includes number of rows , column names, data types of each column, and the memory usage of the entire dataframe. It helps to quickly understand the structure and size of the dataset.
Python Output :
RangeIndex: 50 entries, 0 to 49
Data columns (total 4 columns):
State           50 non-null object
Population      50 non-null int64
Murder.Rate     50 non-null float64
Abbreviation    50 non-null object
dtypes: float64(1), int64(1), object(2)
memory usage: 1.6+ KB
Step 5: Calculating Central Tendencies
Understanding the central tendencies of your data helps you summarize it effectively. In this step we will calculate different central tendency measures such as the mean, trimmed mean, weighted mean, and median for the dataset’s numerical columns.
1. Mean
The mean is the average value of a dataset. It’s calculated by summing all values and dividing by the number of values. In pandas it can be with help of mean() function.
Python Population_mean = data.Population.mean() print ("Population Mean : ", Population_mean) MurderRate_mean = data.MurderRate.mean() print ("\nMurderRate Mean : ", MurderRate_mean) Output:
Population Mean :  6162876.3

MurderRate Mean :  4.066
2. Trimmed Mean
Trimmed mean calculates the average by removing a certain percentage of the highest and lowest values in the dataset. This helps reduce the impact of outliers or extreme values that could skew the overall mean.
Python population_TM = trim_mean(data.Population, 0.1) print ("Population trimmed mean: ", population_TM) murder_TM = trim_mean(data.MurderRate, 0.1) print ("\nMurderRate trimmed mean: ", murder_TM) Output :
Population trimmed mean:  4783697.125

MurderRate trimmed mean:  3.9450000000000003
3. Weighted Mean
A weighted mean assigns different weights to different data points. Here we calculate the murder rate weighted by the population meaning larger states have more influence on the mean.
Python murderRate_WM = np.average(data.MurderRate, weights = data.Population) print ("Weighted MurderRate Mean: ", murderRate_WM) Output :
Weighted MurderRate Mean: 4.445833981123393
4. Median
The median is the middle value when the data is sorted and it is useful for understanding the central tendency especially when the data has outliers.
Python Population_median = data.Population.median() print ("Population median : ", Population_median) MurderRate_median = data.MurderRate.median() print ("\nMurderRate median : ", MurderRate_median) Output :
Population median :  4436369.5

MurderRate median :  4.0
In conclusion you have learn how to use Pandas to perform various EDA tasks such as loading data, inspecting data types, adding and modifying columns, and calculating key statistics like mean, median, and trimmed mean.
Similar Reads
Exploratory Data Analysis in Python | Set 2
In the previous article, we have discussed some basic techniques to analyze the data, now let's see the visual techniques. Let's see the basic techniques - # Loading Libraries import numpy as np import pandas as pd import seaborn as sns import matplotlib.pyplot as plt from scipy.stats import trim_me
4 min read
EDA | Exploratory Data Analysis in Python
Exploratory Data Analysis (EDA) is a important step in data analysis which focuses on understanding patterns, trends and relationships through statistical tools and visualizations. Python offers various libraries like pandas, numPy, matplotlib, seaborn and plotly which enables effective exploration
6 min read
What is Exploratory Data Analysis?
Exploratory Data Analysis (EDA) is a important step in data science as it visualizing data to understand its main features, find patterns and discover how different parts of the data are connected. In this article, we will see more about Exploratory Data Analysis (EDA). Why Exploratory Data Analysis
8 min read
Exploratory Data Analysis in R Programming
Exploratory Data Analysis or EDA is a statistical approach or technique for analyzing data sets to summarize their important and main characteristics generally by using some visual aids. The EDA approach can be used to gather knowledge about the following aspects of data. Main characteristics or fea
11 min read
Exploratory Data Analysis on Iris Dataset
Exploratory Data Analysis (EDA) is a technique to analyze data using some visual Techniques. With this technique, we can get detailed information about the statistical summary of the data. We will also be able to deal with the duplicates values, outliers, and also see some trends or patterns present
9 min read
Sequential Data Analysis in Python
Sequential data, often referred to as ordered data, consists of observations arranged in a specific order. This type of data is not necessarily time-based; it can represent sequences such as text, DNA strands, or user actions. In this article, we are going to explore, sequential data analysis, it's
8 min read
Exploratory Data Analysis (EDA) - Types and Tools
Exploratory data analysis was promoted by John Tukey to encourage statisticians to explore data, and possibly formulate hypotheses that might cause new data collection and experiments. EDA focuses more narrowly on checking assumptions required for model fitting and hypothesis testing. It also checks
6 min read
Steps for Mastering Exploratory Data Analysis | EDA Steps
Mastering exploratory data analysis (EDA) is crucial for understanding your data, identifying patterns, and generating insights that can inform further analysis or decision-making. Data is the lifeblood of cutting-edge groups, and the capability to extract insights from records has become a crucial
15+ min read
10 Python Pandas tips to make data analysis faster
Data analysis using Python's Pandas library is a powerful process, and its efficiency can be enhanced with specific tricks and techniques. These Python tips will make our code concise, readable, and efficient. The adaptability of Pandas makes it an efficient tool for working with structured data. Wh
15 min read
Data Analysis with Python
In this article, we will discuss how to do data analysis with Python. We will discuss all sorts of data analysis i.e. analyzing numerical data with NumPy, Tabular data with Pandas, data visualization Matplotlib, and Exploratory data analysis. Data Analysis With Python Data Analysis is the technique
15+ min read