Power Pivot serves as an Excel add-on enabling robust data analysis and the creation of advanced data models. This tool facilitates the integration of extensive data from diverse sources, enabling swift information analysis and seamless sharing of insights.
Whether working in Excel or Power Pivot, users can generate a Data Model comprising interconnected tables. The data model visible in an Excel workbook corresponds to the one in the Power Pivot window. Importing data into Excel makes it accessible in Power Pivot and vice versa.
Power Pivot: Powerful Data Analysis and Data Modeling in Excel
PowerPivot is an add-in feature of Microsoft Excel. It's a spreadsheet program that extends a local instance of the Microsoft Analysis Services tabular, which is integrated directly into an Excel worksheet. This feature allows users to develop a ROLAP model in Power Pivot and then utilize pivot tables to explore the huge data model once it's been done. In this sense, it functions as a business intelligence platform that uses professional expression languages to query the model and produce advanced measures.
The main expression language of PowerPivot is DAX, or Data Analysis Expressions, which allows the user to define measures based on the data model. It is a tool that can be useful if the user has to calculate a large amount of data because it can analyze and combine millions of rows of table data in seconds.
Tasks in Power Pivot Tables
The main purpose of PowerPivot is to provide a method to summarize a large amount of data. And makes it simple to understand by displaying the data properly and easily, so that the user can easily analyze the large numerical data in detail.
Now let’s try to understand it by using some different examples, of where the PowerPivot can be a useful tool:
- While Comparing the Sales Data: Think of a scenario, where a user needs to maintain a large sales data on a monthly basis, which contains several different products. The user needs to analyze, which product is been bringing the most busk. Of course, it can be done manually, but it will take a lot amount of time, to do it one by one. Instead, by using the pivot table, it can be done in just a few seconds.
- While Creating a List of Employees of Different Departments: Well power pivot is known for automatically doing the calculations. Think of a case, where, where the user has a list of employees, who belongs to several different departments. and the user needs to sort the data out by the name of each department and the counts of employees this work can be a headache if it has to be done manually. However, by creating the pivot table, the data can be sorted by the name of each department and the names of the employees under the department name. With the help of Excel Pivot, this kind of manual work can be done effectively.
- In the case shown of Sorting and Combining Duplicate Data: In this example, think of a scenario, where a user has several duplications in the data, which is affecting the overall sum of data. In this case, the user will have to go through all the data manually to find the duplications and then sort all the data out. Instead, with the help of a pivot table, in just a few steps, the data can be aggregated automatically.
- It shows ExcelExcel the Total Product Sales as Percentages: usually, pivot automatically shows the totals off each row and column while creating them. But it has some other features that make the work easy. Let’s take an example, suppose, a user has quarterly sales data of several different products in Excel sheets, and he turns this data into the pivot table, now the pivot will automatically show the total of each product at the bottom of each column. In addition, if the user needs to know the percentage of each product’s sales, it can also be configured in just a few steps.
To make the pivot table show product sales as percentages of total sales, it simply needs to set a setting by clicking on the right button, in the cell carrying the sales total, and then, simply select the “Show Values As > % of Grand Total”.
Top Features of Power Pivot for Excel
Data Analysis Expressions (DAX)
The powered pivot uses the data analysis expression or DAX as the expression language. This helps extend the data manipulation capabilities of Excel to allow more sophisticated and complex grouping, calculation, and analysis. Which helps maintain large data sets.
Multi-Core Processor
Another feature of power pivot is the feature of multi-core processing and the memory gigabytes, which can be used for faster calculations and processing of thousands of rows in just some seconds. Also, with the help of compression algorithms, it is possible to load a large amount of data into the memory in an efficient manner.
Data can be Imported from Multiple Sources
As previously mentioned, the power pivot allows the user to import and combine data from multiple sources. The data can be sourced from any location for extensive data analysis on the desktop.
Save Data Diagram View in the form of Picture
in the Excel pivot, the data model diagram view can be easily saved as a high-resolution picture, so that it can be later used for printing or analysis. To use this feature, click on the File and select Save the view as the picture.
Security and Management Feature
Another feature of PowerPivot includes security and management, which allows IT managers to measure and control shared applications to assure security, high availability, and performance.
Helpful Tool in Editing Process
With the help of a power pivot, the user can edit the table manually while looking at the sample of data. There can be up to five rows of data in the selected table. With this feature, a user can create and edit data faster and accurately in an efficient manner instead of going back and forth to view data each time.
Data Model
The Data Model is the most powerful feature of Power Pivot. The data that is obtained from various data sources is maintained in Data Model as data tables. You can also create relationships between the data tables so that you can combine the data in the tables for analysis and reporting.
Memory Optimization
Power Pivot Data Model uses xVelocity storage, which is highly compressed when data is loaded into memory which makes it possible to store hundreds of millions of rows in memory.
Power PivotTables
Power PivotTables can be created from the Power Pivot window. PivotTable is so created based on the data tables in the Data Model, making it possible to combine data from the related tables for analysis and reporting.
Power PivotCharts
You can create the Power PivotCharts from the Power Pivot window. The PivotCharts are created on the basis of data tables in the Data model, making it possible to combine data from the related tables for analysis and reporting.
How to Import Data from External Sources into Excel
You can load data into Data Model from external sources in the following ways:
- Load Data into Excel and then create a Power Pivot data model.
- Load data directly into Power Pivot Data Model.
How to Install Power Pivot in Excel
Installation Process
It can be easily downloaded at the official site of Microsoft, the Microsoft Download Centre. Once the installation is done, the icon of PowerPivot will start sowing in Microsoft Excel 2010, as can be seen in the image below:
How to Start the Power Pivot Add-in for Excel
Power Pivot Add-in is a COM Add-in, which is your gateway to unleashing the full potential of Power Pivot within Excel. Elevate your data analysis prowess by harnessing the comprehensive suite of features that are offered by Power Pivot. Follow the below steps to add Power-Pivot in the Ribbon:
Step 1: Click on the File tab
Click the FILE tab on the Ribbon.
Step 2: Click on Options
Click Options in the dropdown list. The Excel Options dialog box appears.
Step 3: Select Add-ins
Select COM Add-ins from the drop down and Click OK.
.png)
Step 4: Select Power Pivot from the Drop-Down
Step 5: Preview Power Pivot in Excel
Now you can see the Power Pivot in the Ribbon.

Power Pivot in Excel- Example
To make it understandable, let's create a simple PowerPivot file as an example by using another file as the data source. There are two tables available, from which, one table contains the breakdown of finances while another is matching the state names with their abbreviations.

Step 1: Click on Manage Button
The first step includes Clicking on the "Manage button" under the “PowerPivot Window”, which can be seen at the top left corner of the ribbon.

Step 2: Select the Data Source
Once the screen got generated, the next step is to select the data source. It can be anything, such as SQL Server Reports, any Data feeds, text files, or Excel files.
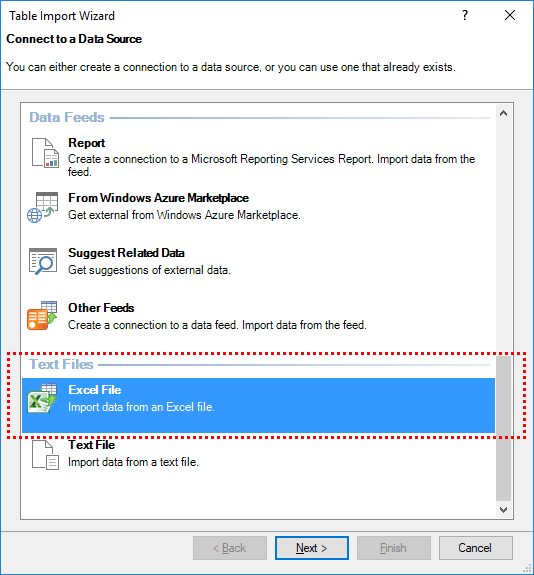
Step 3: Click on From other Sources and Select Excel
Next, click on “From Other Sources” and the window will be popup, as shown below. In the popup window, select the “Excel File” from the section “Text File” and then click on the “Next” button.
Step 4: Select the File
Next, select the Excel file which has the data.

Step 5: Import Data
Next step involves selecting the tables and sheets, from which the data will be imported. Here the data can be imported from multiple source files and sheets.

Step 6: Click on Close
Once you are done, click on the finish button, and click on the Close button to end the process and import the data into the spreadsheet.

The data model is now complete. The imported data is shown in the Excel PowerPivot window. The data tables in this section differ from those in the Excel files. Tables can be simply changed and worked on here. It is also possible to create Pivot charts and Pivot tables here.

Here we have discussed the main features and working of power pivot in Excel. Along with that, it’s the installation process and its use. So, it can be said that this add-in of Microsoft Excel can be a useful tool for many different organizations, that deal with data regularly.
Power of Excel Data Analysis Functions
Excel's data analysis functions stand as formidable tools for professionals across diverse domains. PowerPivot is an exceptional add-in feature, that enhances Excel's capabilities, ushering in a new era of data manipulation and insights. By exploring and mastering these functions, you equip yourself with the skill to navigate complex datasets, draw meaningful conclusions, and make informed decisions.
Also Read
Power PivotCharts
Loading Data with Power Pivot in Excel
Managing Data Model with Excel Power Pivot
Exploring Data with Excel Power Pivot
Features of Excel Power Pivot
Loading Data with Power Pivot in Excel