Skip to content
geeksforgeeks
  • Tutorials
    • Python
    • Java
    • Data Structures & Algorithms
    • ML & Data Science
    • Interview Corner
    • Programming Languages
    • Web Development
    • CS Subjects
    • DevOps And Linux
    • School Learning
    • Practice Coding Problems
  • Courses
    • DSA to Development
    • Get IBM Certification
    • Newly Launched!
      • Master Django Framework
      • Become AWS Certified
    • For Working Professionals
      • Interview 101: DSA & System Design
      • Data Science Training Program
      • JAVA Backend Development (Live)
      • DevOps Engineering (LIVE)
      • Data Structures & Algorithms in Python
    • For Students
      • Placement Preparation Course
      • Data Science (Live)
      • Data Structure & Algorithm-Self Paced (C++/JAVA)
      • Master Competitive Programming (Live)
      • Full Stack Development with React & Node JS (Live)
    • Full Stack Development
    • Data Science Program
    • All Courses
  • Excel Tutorial
  • Excel Formulas
  • Excel Shortcut Keys
  • Data Analysis in Excel
  • Formatting in Excel
  • Excel Workbooks
  • Statistical Functions
  • Data Visualization in Excel
  • Pivot Tables in Excel
  • MS Excel Quiz
  • Excel Interview Questions
  • Advance Excel
Open In App
Next Article:
How to Enable and Use Power View in Excel?
Next article icon

How to Enable and Use Power View in Excel?

Last Updated : 03 Jan, 2023
Comments
Improve
Suggest changes
Like Article
Like
Report

Power View is a sophisticated visualization feature in Microsoft Excel that enables users to generate graphs, charts, and reports. It makes it easy for organizations to produce reports and dashboards that can be shared on a daily, weekly, and monthly basis with stakeholders, managers, and other team members. Power View Excel is regarded as one of the greatest offline reporting tools, and it performs well when paired with Excel Formulae, Pivot Tables, and other functionalities that make data analysis a breeze. It includes analytical tools for doing statistical forecasts and forecasting.

How to Enable Power View with Microsoft Excel?

In this part, you will learn how to enable Power View in Microsoft Excel. To begin, activate the Power View feature in Microsoft Excel settings.

Step 1: Navigate to the File menu, choose More, and then click on Options.

clicking-more-options
 

Step 2: A new window called Excel Choices will appear, displaying numerous options. Click on the Add-ins tab to see all of the possible add-in options.

add-in-options
 

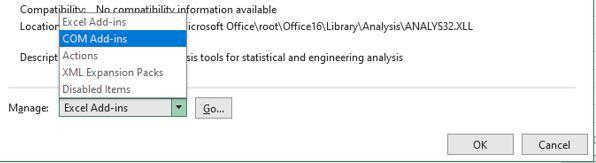
Step 3: Within Add-ins, there is a Manage: option, which offers a dropdown menu with all of the Excel add-ins. Select COM Add-ins from the Manage: menu and press the Go button.

selecting-com-add-ins-options
 

Step 4: Select Microsoft Power View for Excel from the list of COM Add-ins and click OK.

com-add-in-options
 

Step 5: To make Power View visible, you may need to manually add it to the Ribbon. Right-click the Insert group in the Ribbon panel and select Customize the Ribbon.

selecting-customize-ribbon-option
 

Step 6: Create a new group by selecting New Group on the right and renaming it Power View.

renaming-power-view
 

Step 7: Change the selection in the Choose commands from the list from Popular Commands to All Commands.

selecting-all-commands-from-popular-commands
 

Step 8: Scroll down the list and pick Power View. Select Add. Make certain that the destination is the custom Power View and then click OK.

selecting-add
 

Step 9: This will activate the Power View feature in Excel. You may find it under the Insert tab.

activating-power-view-feature
 

Power View Visualization

The Power View's core is its many forms of data visualizations, which allow you to display the data, visualize it, and study it in a dynamic fashion. Large data sets covering many thousands of data points may be handled on the fly by moving from one visualization to another, diving up and drilling down the data to reveal the substance of the data. The following are the many Power View visualizations that you may have:

  • Card
  • Map
  • Line Chart
  • Table
  • Bar Chart
  • Column Chart
  • Matrix
  • Scatter Chart
  • Bubble Chart

You will also learn about the interactive nature of visualization combinations on a Power View.

Tiles Visualization

When you have a lot of data to display at once, scrolling up and down might take a long time. With Tiles, Power View simplifies this work for you. Tiles are navigation strip containers that are based on a field in your data. Clicking on a Tile is the same as picking that field's value, and your visualization is filtered appropriately. Data-bound pictures, such as sports photographs, can be used for Tiles to provide a visual hint to your navigation strip.

Hierarchies in Power View

If your data contains nested fields, you can create a hierarchy to treat all of the nested fields as a single field. You can have a defined hierarchy in the Data Model that Power View can visualize, or you can create a hierarchy in Power View and use it for visualization. In Matrix, Bar Chart, Column Chart, and Pie Chart visualizations, you can drill up and down the hierarchy. With a Column Chart, you can filter the hierarchy in a Pie Chart.

Features of Power View

  • Power View is a sophisticated business intelligence tool that can absorb data, analyze it, and visualize it to deliver improved insights into operations and performance.
  • Power View can handle large amounts of data fast.
  • Power View has outstanding Machine Learning libraries that assist users in performing predictive analytics.
  • Power View includes pre-built templates that enable businesses to create an effective dashboard for in-depth data analysis.
  • Power View offers a simple interface that allows users to navigate easily.
  • Other systems that Power View can interface with include Office 365, Spark, Hadoop, GA, Salesforce, MailChimp, and many more.

Sharing Work

You may share your work with the pertinent parties as the Power View sheets in your Excel workbook itself on the server/cloud by granting suitable read/edit rights. You may share your Power View reports as SharePoint reports because Power View is also available on SharePoint. You can print Power View sheets, but because they are static, they would be unproductive due to their inherent potent attributes of interaction and dynamic nature. Power View sheets may be published to Power BI.

Conclusion

Power View allows for interactive data exploration, visualization, and presentation, promoting easy ad hoc reporting.


Next Article
How to Enable and Use Power View in Excel?

C

chetanpahwa
Improve
Article Tags :
  • Excel
  • Technical Scripter 2022
  • Excel-PowerView
  • ExcelGuide

Similar Reads

    How to Enable Dark Mode in Excel (Windows & Mac)
    Reduce eye strain and enhance your productivity with Excel's Dark Mode! This guide provides easy-to-follow steps on how to enable Dark Mode in Microsoft Excel for both Windows and Mac. Learn how to customize your Excel experience with a visually appealing and less-distracting interface.Full Dark Mod
    3 min read
    Aesthetic Power View Reports in Excel
    Power View is used to create interactive reports to analyze the data. We can also make these reports more attractive by changing the themes, fonts, background colors, and chart palettes. In order to make the reports more attractive by adding background images and we can also change the size of the t
    4 min read
    How to Create a Power PivotTable in Excel?
    When we have to compare the data (such as name/product/items, etc.) between any of the columns in excel then we can easily do with the help of Pivot table and pivot charts. But it fails when it comes to comparing those data which are in two different datasets, at that time Power Pivot comes into rol
    4 min read
    How to connect Power BI to WooCommerce in Excel?
    Power BI is a data visualization and business intelligence tool which is used to connect to various data sources that include WooCommerce and can also use to transform and clean the data, and create interactive visualizations and reports of the data, with the sharing feature. It includes various fea
    2 min read
    How to Insert or Show Power View in Excel?
    Power View is one of the features of excel, which enables us to visualize, explore and present large data sets and encourage ad-hoc reporting. The larger data sets can be easily visualized and analyzed in excel using the Power View and this data visualization is dynamic which helps to present the da
    2 min read
geeksforgeeks-footer-logo
Corporate & Communications Address:
A-143, 7th Floor, Sovereign Corporate Tower, Sector- 136, Noida, Uttar Pradesh (201305)
Registered Address:
K 061, Tower K, Gulshan Vivante Apartment, Sector 137, Noida, Gautam Buddh Nagar, Uttar Pradesh, 201305
GFG App on Play Store GFG App on App Store
Advertise with us
  • Company
  • About Us
  • Legal
  • Privacy Policy
  • In Media
  • Contact Us
  • Advertise with us
  • GFG Corporate Solution
  • Placement Training Program
  • Languages
  • Python
  • Java
  • C++
  • PHP
  • GoLang
  • SQL
  • R Language
  • Android Tutorial
  • Tutorials Archive
  • DSA
  • Data Structures
  • Algorithms
  • DSA for Beginners
  • Basic DSA Problems
  • DSA Roadmap
  • Top 100 DSA Interview Problems
  • DSA Roadmap by Sandeep Jain
  • All Cheat Sheets
  • Data Science & ML
  • Data Science With Python
  • Data Science For Beginner
  • Machine Learning
  • ML Maths
  • Data Visualisation
  • Pandas
  • NumPy
  • NLP
  • Deep Learning
  • Web Technologies
  • HTML
  • CSS
  • JavaScript
  • TypeScript
  • ReactJS
  • NextJS
  • Bootstrap
  • Web Design
  • Python Tutorial
  • Python Programming Examples
  • Python Projects
  • Python Tkinter
  • Python Web Scraping
  • OpenCV Tutorial
  • Python Interview Question
  • Django
  • Computer Science
  • Operating Systems
  • Computer Network
  • Database Management System
  • Software Engineering
  • Digital Logic Design
  • Engineering Maths
  • Software Development
  • Software Testing
  • DevOps
  • Git
  • Linux
  • AWS
  • Docker
  • Kubernetes
  • Azure
  • GCP
  • DevOps Roadmap
  • System Design
  • High Level Design
  • Low Level Design
  • UML Diagrams
  • Interview Guide
  • Design Patterns
  • OOAD
  • System Design Bootcamp
  • Interview Questions
  • Inteview Preparation
  • Competitive Programming
  • Top DS or Algo for CP
  • Company-Wise Recruitment Process
  • Company-Wise Preparation
  • Aptitude Preparation
  • Puzzles
  • School Subjects
  • Mathematics
  • Physics
  • Chemistry
  • Biology
  • Social Science
  • English Grammar
  • Commerce
  • World GK
  • GeeksforGeeks Videos
  • DSA
  • Python
  • Java
  • C++
  • Web Development
  • Data Science
  • CS Subjects
@GeeksforGeeks, Sanchhaya Education Private Limited, All rights reserved
We use cookies to ensure you have the best browsing experience on our website. By using our site, you acknowledge that you have read and understood our Cookie Policy & Privacy Policy
Lightbox
Improvement
Suggest Changes
Help us improve. Share your suggestions to enhance the article. Contribute your expertise and make a difference in the GeeksforGeeks portal.
geeksforgeeks-suggest-icon
Create Improvement
Enhance the article with your expertise. Contribute to the GeeksforGeeks community and help create better learning resources for all.
geeksforgeeks-improvement-icon
Suggest Changes
min 4 words, max Words Limit:1000

Thank You!

Your suggestions are valuable to us.

What kind of Experience do you want to share?

Interview Experiences
Admission Experiences
Career Journeys
Work Experiences
Campus Experiences
Competitive Exam Experiences