Change Color of Bars in Barchart using ggplot2 in R
Last Updated : 06 Jun, 2021
In this article, we are going to see various methods to change the color of a bar chart using ggplot2 in the R programming language.
For creating a simple bar plot we will use the function geom_bar( ).
Syntax:
geom_bar(stat, fill, color, width)
Parameters :
- stat : Set the stat parameter to identify the mode.
- fill : Represents color inside the bars.
- color : Represents color of outlines of the bars.
- width : Represents width of the bars.
Dataset in Use:

Let us first plot a regular barplot to display what a regular plot without any help will be printed.
Example:
R library(ggplot2) # Inserting data ODI <- data.frame(match=c("M-1","M-2","M-3","M-4"), runs=c(67,37,74,10)) # Basic vertical barplot perf <-ggplot(data=ODI, aes(x=match, y=runs))+ geom_bar(stat="identity") perf # Horizontal bar plot perf+coord_flip() Output:
 Bar Plot
 Now let us see how colors are added to the barplot.
Method 1: Using default colors
Use the command fill to add color inside the bars. Since, the bars are in different x-axis values we need to assign the x-axis variable to the fill. In our case, match is in the x-axis, so we write fill=match. You need to write this command inside the aes() also known as the quoting function or aesthetic function under the ggplot2 library.
Example:
R library(ggplot2) # Inserting data ODI <- data.frame(match=c("M-1","M-2","M-3","M-4"), runs=c(67,37,74,10)) # Assigning default and different colors to bar plot perf <-ggplot(data=ODI, aes(x=match, y=runs,fill=match))+ geom_bar(stat="identity") perf Output:

Use the same fill. But this time since we have to assign a single color we will use it inside the geom_bar( ). Then assign the color of your choice to the fill as shown below. The theme is changed because some color plots might not be visible to the default theme in R.
Example:
R library(ggplot2) # Inserting data ODI <- data.frame(match=c("M-1","M-2","M-3","M-4"), runs=c(67,37,74,10)) # Assigning default and same colors to bar plot perf <-ggplot(data=ODI, aes(x=match, y=runs))+ geom_bar(stat="identity",fill="lightblue")+ theme_dark() perf Output:

Here we need a command color for assigning colors to the outline. Outline colors look good when the fill color is white. It is the property of color because some colors overshadow other colors or if we assign same color to fill and outline both. Since we need the same fill and the same outline we will write these commands inside the geom_bar( ).
Example:
R library(ggplot2) # Inserting data ODI <- data.frame(match=c("M-1","M-2","M-3","M-4"), runs=c(67,37,74,10)) # Assigning default and same outline colors to bar plot perf <-ggplot(data=ODI, aes(x=match, y=runs))+ geom_bar(stat="identity",color="red",fill="white")+ theme_classic() perf Output:

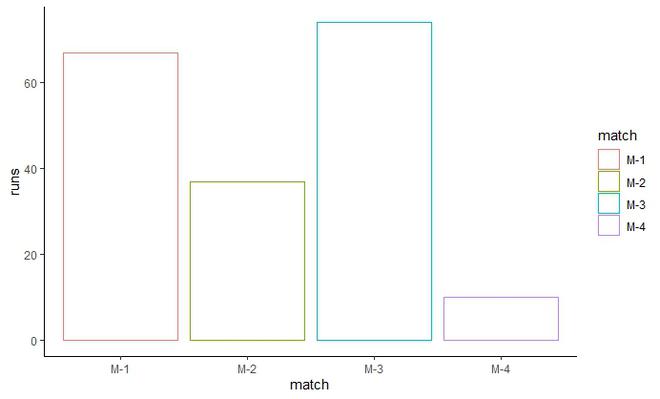
Here we need to provide different outlines. The fill will be the same which is white. The fill will be inside the geom_bar( ). The color will be inside aes( ) under ggplot( ) as it is variable in this case.
Example:
R library(ggplot2) # Inserting data ODI <- data.frame(match=c("M-1","M-2","M-3","M-4"), runs=c(67,37,74,10)) # Assigning default and different outline colors to bar plot perf <-ggplot(data=ODI, aes(x=match, y=runs,color=match))+ geom_bar(stat="identity",fill="white")+ theme_classic() perf Output:
Method 2: Setting color manually
This function is used to provide custom colors. We can either write the color code as "#XXXXXX" or we can directly write the color name as "color_name". The fill will be inside the ggplot2 as we need to manually assign different colors to the bars. Invoke the function and manually insert a vector which consists of the color code or the color name. The length of the vector should be same as the number of bars.
Example:
R library(ggplot2) # Inserting data ODI <- data.frame(match=c("M-1","M-2","M-3","M-4"), runs=c(67,37,74,10)) # Assigning colors manually perf <-ggplot(data=ODI, aes(x=match, y=runs,fill=match))+ geom_bar(stat="identity")+ scale_fill_manual(values=c("#9933FF", "#33FFFF", "red", "darkblue")) perf Output:

Similarly, we can set outlines color manually. Just replace the keyword fill everywhere to color in the above code. The function will now become : scale_color_manual( )
The function used here is scale_fill_grey( ). The fill is inside the aes( ) as we need different gray scale colors. Invoke the function scale_fill_grey( ) at last.
Example:
R library(ggplot2) # Inserting data ODI <- data.frame(match=c("M-1","M-2","M-3","M-4"), runs=c(67,37,74,10)) # Assigning gray scale colors perf <-ggplot(data=ODI, aes(x=match, y=runs,fill=match))+ geom_bar(stat="identity")+ scale_fill_grey() perf Output:

Similar Reads
How to change background color in R using ggplot2? In this article, we will discuss how to change the background color of a ggplot2 plot in R Programming Language. To do so first we will create a basic ggplot2 plot. Step 1: Create sample data for the plot. sample_data <- data.frame(x = 1:10, y = 1:10) Step 2: Load the package ggplot2. library("gg
2 min read
Change Space and Width of Bars in ggplot2 Barplot in R In this article, we will see how to change the Space and width of bars in ggplot2 barplot in R. For Create a simple Barplot using ggplot2, first we have to load the ggplot2 package using the library() function. If you have not already installed then you can install it by writing the below command i
4 min read
Change the Outline Color for Histogram Bars Using ggplot2 in R In data visualization, customizing the appearance of a plot can greatly enhance its readability and presentation. One common customization when working with histograms is changing the outline color of the bars. By default, ggplot2 may not always add outlines, but you can easily modify this behavior
4 min read
Change Color of ggplot2 Boxplot in R In this article, we are going to see how to change the color of boxplots using ggplot2 in R Programming Language. We have considered the built-in data frame "ChickWeight". It contains information about the feed type and growth rate of chickens for six different types of foods like casein, soybean,
3 min read
Change Theme Color in ggplot2 Plot in R A theme in ggplot2 is a collection of settings that control the non-data elements of the plot. These settings include things like background colors, grid lines, axis labels, and text sizes. we can use various theme-related functions to customize the appearance of your plots, including changing theme
4 min read