Anomaly Detection in Time Series in R
Last Updated : 06 May, 2025
Anomaly detection in time series involves identifying unusual data points that deviate significantly from expected patterns or trends. It is essential for detecting irregularities like spikes, dips or potential failures in systems or applications. Common use cases for anomaly detection include monitoring internet traffic, identifying DDoS attacks or spotting unusual behaviors in financial or industrial data.
Key Concepts in Anomaly Detection
- Trend: The overall long-term movement in the data. It helps identify the general direction (whether data points are increasing, decreasing or remaining constant over time). For example, the trend in stock prices typically shows long-term growth or decline.
- Seasonality: These are recurring patterns in the data that occur at regular intervals. For instance, sales of holiday packages may spike during summer or winter vacations when schools and colleges are closed. Identifying seasonality helps in understanding and anticipating regular fluctuations in the data.
- Residue: The leftover data that does not align with the identified trends or seasonality. Residuals can be considered anomalies or outliers. These are points that do not fit the expected patterns and may indicate an issue, such as a system malfunction or an unexpected market behavior.
Steps in Anomaly Detection
- Identify the Trend: Determine the general direction in which the data points are moving over time.
- Find Seasonal Patterns: Recognize recurring cycles or patterns in the data.
- Calculate Residuals: Subtract the trend and seasonality from the data, leaving only the residue, which is where anomalies are detected.
- Set Thresholds: Determine upper and lower bounds based on the trend, seasonality and residuals. Data points outside these bounds are flagged as anomalies.
Implementation of Anomaly Detection in R
In this example, we are going to explore the monthly electricity usage of a home and find the anomalies. Dataset: Monthly Electricity Consumption Data .
1. Load the libraries
We are going to use the following two libraries:
- tidyverse: It makes it easy to install and load core packages from the tidyverse in a single command.
- anomalize: It provides a tidy workflow to find anomalies in the dataset.
R library(tidyverse) library(anomalize)
2. Read the csv file.
We use the read.csv() function to read the contents of our csv file and display some of the rows.
R data = read.csv("/kaggle/input/electricity-consumption/electricity_consumption.csv") head(data) Output:
Bill_Date On_peak Off_peak Usage_charge Billed_amount Billing_days
1 2016-01-01 365 1423.5 219.0 247.73 31
2 2016-02-01 292 1138.8 175.2 234.11 31
3 2016-03-01 130 507.0 78.0 123.85 29
4 2016-04-01 117 456.3 70.2 111.22 29
5 2016-05-01 136 530.4 81.6 118.37 29
6 2016-06-01 63 245.7 37.8 77.81 32
3. Fixing Datatypes
We need to convert Bill_Date column to date. We also can see that it is recorded every month first day. Hence we will be converting Bill_Date column into Date type using that type of formating.
- as.Date: This method converts from one type of data frame to another datatype as we did to convert it to Date type.
- as_tibble: Since anomalize works on tibble data type, we need to convert the data frame in tibble object.
R data$Bill_Date <- as.Date(data$Bill_Date, format = "%Y-%m-%d") data <- as_tibble(data) head(data)
Output:
A tibble: 6 × 6
Bill_Date On_peak Off_peak Usage_charge Billed_amount Billing_days
<date> <int> <dbl> <dbl> <dbl> <int>
1 2016-01-01 365 1424. 219 248. 31
2 2016-02-01 292 1139. 175. 234. 31
3 2016-03-01 130 507 78 124. 29
4 2016-04-01 117 456. 70.2 111. 29
5 2016-05-01 136 530. 81.6 118. 29
6 2016-06-01 63 246. 37.8 77.8 32
4. Detecting Anomalies
Now we will check anomaly on the On_peak column as follows and then preview the data
R data_anomalized <- data %>% time_decompose(On_peak, merge = TRUE) %>% anomalize(remainder) %>% time_recompose() head(data_anomalized)
Output:
A time tibble: 6 × 15
Index: Bill_Date
Bill_Date On_peak Off_peak Usage_charge Billed_amount Billing_days observed season
<date> <int> <dbl> <dbl> <dbl> <int> <dbl> <dbl>
1 2016-01-01 365 1424. 219 248. 31 365 50.9
2 2016-02-01 292 1139. 175. 234. 31 292 11.1
3 2016-03-01 130 507 78 124. 29 130 -74.1
4 2016-04-01 117 456. 70.2 111. 29 117 -115.
5 2016-05-01 136 530. 81.6 118. 29 136 -66.3
6 2016-06-01 63 246. 37.8 77.8 32 63 26.1
time_decompose: As we learn that we need to explore the trends, seasonality and residue, it works as same to explore the dataset based on the column of Date type. The time_decompose() function generates a time series decomposition on tbl_time objects. So we want to decompose the dataset and explore the trends based on the column On_peak as we have provided.
- anomalize(residue): After decomposing the dataset into trend, seasonality and residue, we want the anomalies. So we pass the residue to this function. It has inbuilt anomaly detection algorithms.
- time_recompose(): Now we got the anomalies and the original dataset, it is time to create a new dataframe. So we store the recomposed data into data_anomalized and then when we preview using the glimpse() method, we see a column anomaly where the prediction is given as anomaly or not.
5. Visualizing the Anomalies
We can even visualize the anomalies using the anomalize package as it provides plotting methods. We can plot the data_anomalized using plot_anomalies. The red dots are the outliers here. The alpha_dots controls the transparency of the dots.
R data_anomalized %>% plot_anomalies(alpha_dots = 0.75)
Output:
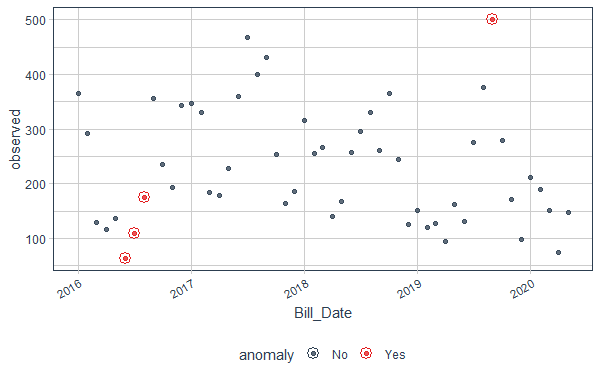 Anomaly Detection in Time Series in R
To plot each of trend, seasonality and residue, along with the observed value, we can use the method plot_anomaly_decomposition() which visualize the time series decomposition with anomalies shown
R plot_anomaly_decomposition(data_anomalized)
Output:
 Anomaly Detection in Time Series in R
Filtering Anomalies from the Dataset
To get the anomalies only from the dataset, we can use the filter command along with the anomalize function used in the previous step. First decompose the dataset, find anomalies using anomalize, recompose it and then use the filter command. We filter based on the condition that anomaly column is true.
R data %>% time_decompose(On_peak) %>% anomalize(remainder) %>% time_recompose() %>% filter(anomaly == 'Yes')
Output:
A time tibble: 4 × 10
Index: Bill_Date
Bill_Date observed season trend remainder remainder_l1 remainder_l2 anomaly
<date> <dbl> <dbl> <dbl> <dbl> <dbl> <dbl> <chr>
1 2016-06-01 63 26.1 251. -215. -166. 167. Yes
2 2016-07-01 110 88.2 255. -233. -166. 167. Yes
3 2016-08-01 176 131. 258. -213. -166. 167. Yes
4 2019-09-01 501 95.6 203. 202. -166. 167. Yes
# ℹ 2 more variables: recomposed_l1 <dbl>, recomposed_l2 <dbl>
Controlling the number of Anomalies
We can also control the number of anomalies we want.
- The anomalize() method takes the following parameter to control it:
- max_anoms: The maximum percent of anomalies permitted to be identified.
- plot_anomalies: It is used to plot the the anomalies in one or multiple time series.
1. Suppose we want 25% dataset to be anomaly. So we change the value to 0.25.
R data %>% time_decompose(On_peak) %>% anomalize(remainder, alpha = 0.75, max_anoms = 0.25) %>% time_recompose() %>% plot_anomalies(time_recomposed = TRUE) + ggtitle("25% Anomalies Allowed") Output:
 Anomaly Detection in Time Series in R
2. Similarly if we want just 5%, we will provide 0.05 in max_anoms.
R data %>% time_decompose(On_peak) %>% anomalize(remainder, alpha = 0.75, max_anoms = 0.05) %>% time_recompose() %>% plot_anomalies(time_recomposed = TRUE) + ggtitle("5% Anomalies Allowed ") Output:
 Anomaly Detection in Time Series in R
In this article we learnt to find anomalies using the anomalize package in R. We learnt to find the trends, seasonality, residue. Finally we learnt to control the percentage of anomalies in the dataset.
Similar Reads
Time Series Analysis in R Time series analysis is a statistical technique used to understand how data points evolve over time. In R programming, time series analysis can be efficiently performed using the ts() function, which helps organize data with associated time stamps. This method is widely applied in business and resea
3 min read
Anomaly Detection Using R Anomaly detection is a critical aspect of data analysis, allowing us to identify unusual patterns, outliers, or abnormalities within datasets. It plays a pivotal role across various domains such as finance, cybersecurity, healthcare, and more. What is Anomalies?Anomalies, also known as outliers, are
13 min read
What is Anomaly Detection? Anomaly Detection, additionally known as outlier detection, is a technique in records analysis and machine studying that detects statistics points, activities, or observations that vary drastically from the dataset's ordinary behavior. These abnormalities may sign extreme conditions which include mi
14 min read
Anomaly detection in Distributed Systems Anomaly detection in distributed systems is a critical aspect of maintaining system health and performance. Distributed systems, which span multiple machines or nodes, require robust methods to identify and address irregularities that could indicate issues like failures, security breaches, or perfor
6 min read
Aggregating Time Series in R Time series data can consist of the observations recorded at the specific time intervals. It can be widely used in fields such as economics, finance, environmental science, and many others. Aggregating time series data can involve summarizing the data over the specified period to extract meaningful
6 min read